Get Your Free Spectral Analysis Solution.
Tell us about your requirements. Our experts will contact you within 24 hours.
The ConstSpec series of high-stability spectrometers is the latest cost-effective product line launched by LiSen Optics, specifically designed for users with high demands for precision and reliability in spectral analysis. This series of spectrometers combines advanced optical technology with precise mechanical design to ensure highly stable performance under various environmental conditions.
The ConstSpec series of high-stability spectrometers is the latest cost-effective product line launched by LiSen Optics, specifically designed for users with high demands for precision and reliability in spectral analysis. This series of spectrometers combines advanced optical technology with precise mechanical design to ensure highly stable performance under various environmental conditions.
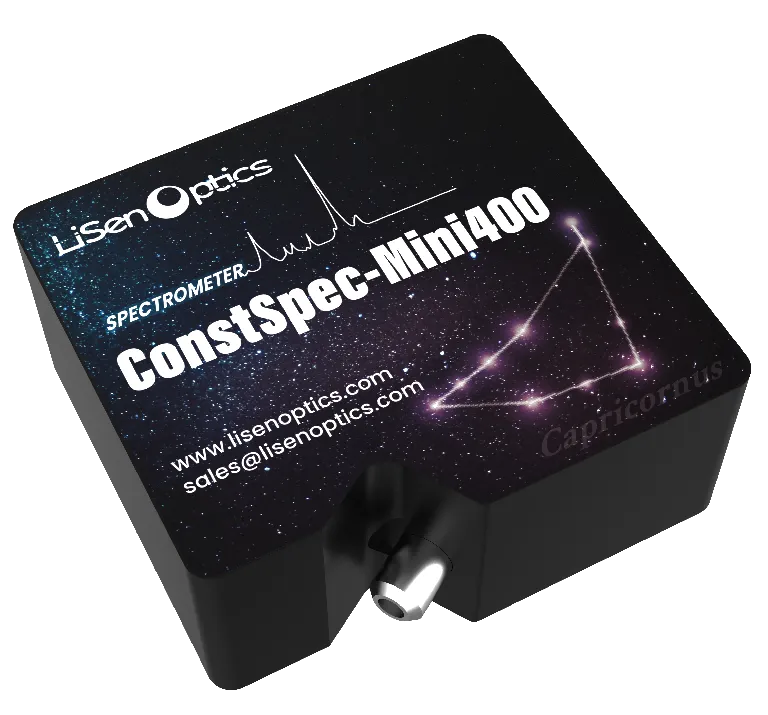
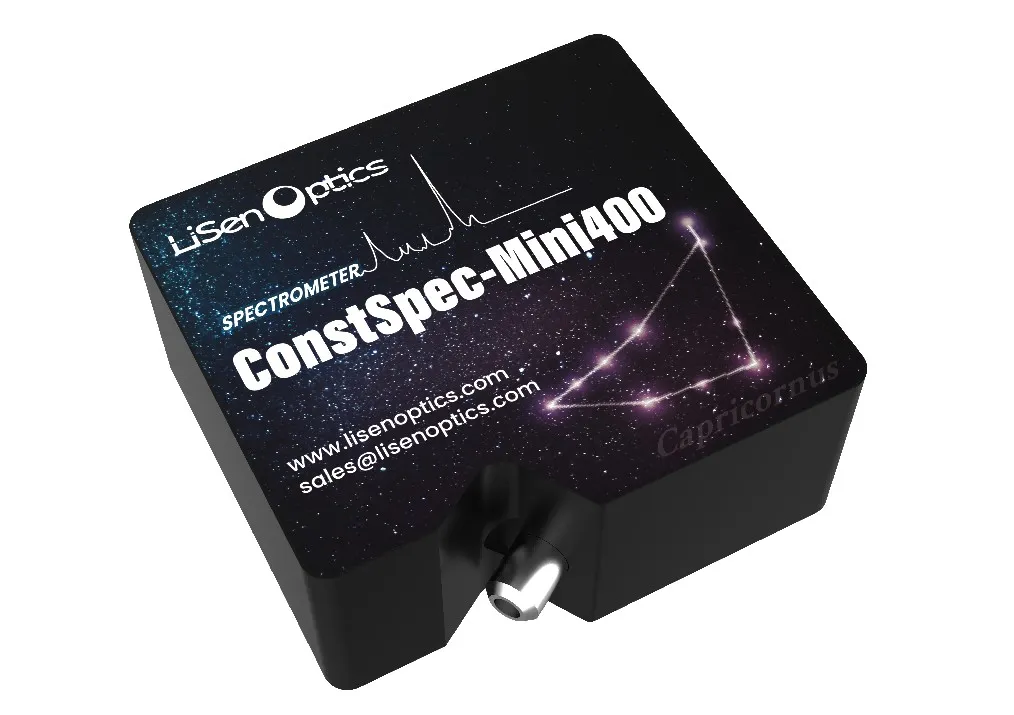
The ConstSpec-Mini400 spectrometer features a compact and robust casing, with a significantly improved internal design. Its small size makes it an ideal module for system integration and is also highly suitable for handheld applications, allowing for easy portability.
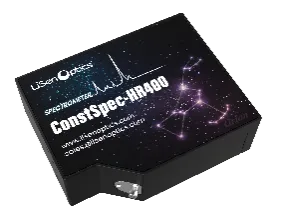
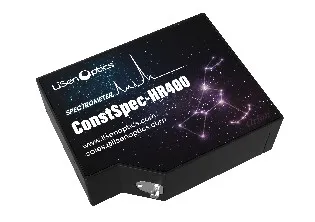
The ConstSpec-HR400 spectrometer successfully combines high quantum efficiency and high measurement speed in the UV-Vis-NIR range. Its unique stray light elimination technology, noise reduction circuit control technology, along with outstanding detector performance, greatly enhances the spectrometer's sensitivity and signal-to-noise ratio. It exhibits exceptional sensitivity in the 200-1100nm wavelength range, making it highly suitable for applications such as UV radiation spectrum, fluorescence measurement, and transmission/reflection measurement.
Additionally, the compact design of the ConstSpec series spectrometers makes them space-efficient in both laboratory and industrial settings, facilitating easy installation and maintenance.
Whether for production line monitoring, quality control, or environmental monitoring, the ConstSpec series spectrometers offer excellent cost-performance ratio and durability, providing consistent measurement results and reliable data support. This reduces the impact of data fluctuations on analysis, delivering an outstanding analytical experience for users.
 |
 |
Technical Advantages and Features
● Spectral Range 200-1100nm: Offers flexible slit replacement and various optical accessories, allowing for versatile expansion.
● High Cost-Performance Ratio: Combines excellent performance with simplicity and ease of use, enabling quick mastery of spectral analysis essentials and providing reliable data analysis solutions.
● Guaranteed Stability and Durability: Ensures accurate data and adapts to diverse working environments and long-term usage needs.
● LiSpecView Full-Function Spectral Testing Software: Provides multiple measurement modules including transmission/reflection, absolute radiation, Raman, absorbance, laser power, and color measurement.
The ConstSpec-Mini400 spectrometer features a compact and robust casing, with a significantly improved internal design. Its small size makes it an ideal module for system integration and is also highly suitable for handheld applications, allowing for easy portability.
The ConstSpec-HR400 spectrometer successfully combines high quantum efficiency and high measurement speed in the UV-Vis-NIR range. Its unique stray light elimination technology, noise reduction circuit control technology, along with outstanding detector performance, greatly enhances the spectrometer's sensitivity and signal-to-noise ratio. It exhibits exceptional sensitivity in the 200-1100nm wavelength range, making it highly suitable for applications such as UV radiation spectrum, fluorescence measurement, and transmission/reflection measurement.
Additionally, the compact design of the ConstSpec series spectrometers makes them space-efficient in both laboratory and industrial settings, facilitating easy installation and maintenance.
Whether for production line monitoring, quality control, or environmental monitoring, the ConstSpec series spectrometers offer excellent cost-performance ratio and durability, providing consistent measurement results and reliable data support. This reduces the impact of data fluctuations on analysis, delivering an outstanding analytical experience for users.
|
|
Technical Advantages and Features
● Spectral Range 200-1100nm: Offers flexible slit replacement and various optical accessories, allowing for versatile expansion.
● High Cost-Performance Ratio: Combines excellent performance with simplicity and ease of use, enabling quick mastery of spectral analysis essentials and providing reliable data analysis solutions.
● Guaranteed Stability and Durability: Ensures accurate data and adapts to diverse working environments and long-term usage needs.
● LiSpecView Full-Function Spectral Testing Software: Provides multiple measurement modules including transmission/reflection, absolute radiation, Raman, absorbance, laser power, and color measurement.
Main Technical Indicators
|
Model |
ConstSpec-Mini400 |
ConstSpec-HR400 |
|
Pic. |
|
|
|
Spectral Range |
200-1100nm |
200-1100nm |
|
Optical Resolution (FWHM) |
1-10nm |
0.2-7nm |
|
Wavelength Accuracy |
≤0.5nm |
≤0.5nm |
|
Stray Light |
<0.2% |
<0.1% |
|
Detector |
Linear array 2048-pixel CMOS |
Linear array 2048-pixel CMOS |
|
Signal-to-Noise Ratio |
400:01:00 |
450:01:00 |
|
Dynamic Range |
2000:01:00 |
5000:01:00 |
|
Dark Noise (RMS) |
20 counts |
20 counts |
|
AD Conversion |
16-bit, 0.5MHz |
16-bit, 0.5MHz |
|
Integration Time |
1ms-65s |
1ms-65s |
|
Communication Interface |
USB 2.0/RS-232 |
USB 2.0/RS-232 |
|
I/O Interface |
IPT1-10 interface, 1 serial signal, 2 external triggers for spectral acquisition, 1 custom digital level input signal, 3 status signals, 2 custom digital level output signals, 1 power supply |
DB-15 interface, 1 serial signal, 2 external triggers for spectral acquisition, 3 custom digital level input signals, 3 status signals, 5 custom digital level output signals, 1 power supply |
|
Power Supply |
100 mA/5V DC, USB default power supply |
250mA/5V DC, USB default power supply |
|
Operating Temperature |
-5°C~55°C |
-5°C~55°C |
|
Dimensions |
60×55×26mm |
150×115×45mm |
Spectrometer’s Resolution Selection Table
|
ConstSpec-Mini400 |
||||||||
|
NO. |
Wavelength Range(nm) |
Grating |
Grating. |
Slit Width(μm) |
||||
|
Lines(lines/mm) |
10 |
25 |
50 |
100 |
200 |
|||
|
Resolution(nm) |
||||||||
|
1 |
200-1100 |
900 |
600 g/mm |
1.8 |
2.5 |
4 |
6 |
12 |
|
2 |
300-1000 |
700 |
600 g/mm |
1.8 |
2.5 |
4 |
6 |
12 |
|
3 |
190-840 |
650 |
900 g/mm |
1.2 |
1.6 |
2.5 |
5 |
10 |
|
4 |
400-900 |
500 |
900 g/mm |
1.2 |
1.6 |
2.5 |
5 |
10 |
|
5 |
350-800 |
450 |
1200 g/mm |
1 |
1.4 |
2 |
4 |
8 |
|
6 |
800-1100 |
300 |
1800 g/mm |
0.8 |
1 |
1.4 |
2.5 |
5 |
|
7 |
180-420 |
240 |
2400 g/mm |
0.6 |
0.8 |
1 |
2 |
4 |
|
ConstSpec-HR400 |
||||||||
|
NO. |
Wavelength Range(nm) |
Grating Lines(lines/mm) |
Grating. |
Slit Width(μm) |
||||
|
Lines(lines/mm) |
10 |
25 |
50 |
100 |
200 |
|||
|
Resolution(nm) |
||||||||
|
1 |
200-1100 |
900 |
300 g/mm |
1 |
1.1 |
2 |
4 |
7 |
|
2 |
300-1000 |
700 |
400 g/mm |
0.7 |
0.9 |
1.4 |
3 |
5.5 |
|
3 |
190-840 |
650 |
400 g/mm |
0.65 |
0.8 |
1.3 |
2.6 |
5.3 |
|
4 |
400-900 |
500 |
500 g/mm |
0.5 |
0.65 |
1 |
2 |
4 |
|
5 |
350-800 |
450 |
600 g/mm |
4 |
0.55 |
0.9 |
1.8 |
3.5 |
|
6 |
800-1100 |
300 |
900 g/mm |
0.3 |
0.4 |
0.6 |
1.2 |
2.4 |
|
7 |
180-420 |
240 |
1200 g/mm |
0.25 |
0.3 |
0.5 |
1 |
2 |
Main Technical Indicators
|
Model |
ConstSpec-Mini400 |
ConstSpec-HR400 |
|
Pic. |
|
|
|
Spectral Range |
200-1100nm |
200-1100nm |
|
Optical Resolution (FWHM) |
1-10nm |
0.2-7nm |
|
Wavelength Accuracy |
≤0.5nm |
≤0.5nm |
|
Stray Light |
<0.2% |
<0.1% |
|
Detector |
Linear array 2048-pixel CMOS |
Linear array 2048-pixel CMOS |
|
Signal-to-Noise Ratio |
400:01:00 |
450:01:00 |
|
Dynamic Range |
2000:01:00 |
5000:01:00 |
|
Dark Noise (RMS) |
20 counts |
20 counts |
|
AD Conversion |
16-bit, 0.5MHz |
16-bit, 0.5MHz |
|
Integration Time |
1ms-65s |
1ms-65s |
|
Communication Interface |
USB 2.0/RS-232 |
USB 2.0/RS-232 |
|
I/O Interface |
IPT1-10 interface, 1 serial signal, 2 external triggers for spectral acquisition, 1 custom digital level input signal, 3 status signals, 2 custom digital level output signals, 1 power supply |
DB-15 interface, 1 serial signal, 2 external triggers for spectral acquisition, 3 custom digital level input signals, 3 status signals, 5 custom digital level output signals, 1 power supply |
|
Power Supply |
100 mA/5V DC, USB default power supply |
250mA/5V DC, USB default power supply |
|
Operating Temperature |
-5°C~55°C |
-5°C~55°C |
|
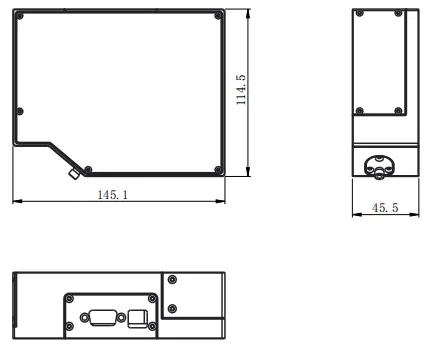
Dimensions |
60×55×26mm |
150×115×45mm |
Spectrometer’s Resolution Selection Table
|
ConstSpec-Mini400 |
||||||||
|
NO. |
Wavelength Range(nm) |
Grating |
Grating. |
Slit Width(μm) |
||||
|
Lines(lines/mm) |
10 |
25 |
50 |
100 |
200 |
|||
|
Resolution(nm) |
||||||||
|
1 |
200-1100 |
900 |
600 g/mm |
1.8 |
2.5 |
4 |
6 |
12 |
|
2 |
300-1000 |
700 |
600 g/mm |
1.8 |
2.5 |
4 |
6 |
12 |
|
3 |
190-840 |
650 |
900 g/mm |
1.2 |
1.6 |
2.5 |
5 |
10 |
|
4 |
400-900 |
500 |
900 g/mm |
1.2 |
1.6 |
2.5 |
5 |
10 |
|
5 |
350-800 |
450 |
1200 g/mm |
1 |
1.4 |
2 |
4 |
8 |
|
6 |
800-1100 |
300 |
1800 g/mm |
0.8 |
1 |
1.4 |
2.5 |
5 |
|
7 |
180-420 |
240 |
2400 g/mm |
0.6 |
0.8 |
1 |
2 |
4 |
|
ConstSpec-HR400 |
||||||||
|
NO. |
Wavelength Range(nm) |
Grating Lines(lines/mm) |
Grating. |
Slit Width(μm) |
||||
|
Lines(lines/mm) |
10 |
25 |
50 |
100 |
200 |
|||
|
Resolution(nm) |
||||||||
|
1 |
200-1100 |
900 |
300 g/mm |
1 |
1.1 |
2 |
4 |
7 |
|
2 |
300-1000 |
700 |
400 g/mm |
0.7 |
0.9 |
1.4 |
3 |
5.5 |
|
3 |
190-840 |
650 |
400 g/mm |
0.65 |
0.8 |
1.3 |
2.6 |
5.3 |
|
4 |
400-900 |
500 |
500 g/mm |
0.5 |
0.65 |
1 |
2 |
4 |
|
5 |
350-800 |
450 |
600 g/mm |
4 |
0.55 |
0.9 |
1.8 |
3.5 |
|
6 |
800-1100 |
300 |
900 g/mm |
0.3 |
0.4 |
0.6 |
1.2 |
2.4 |
|
7 |
180-420 |
240 |
1200 g/mm |
0.25 |
0.3 |
0.5 |
1 |
2 |
Dimension (Unit: mm)
● ConstSpec-Mini400
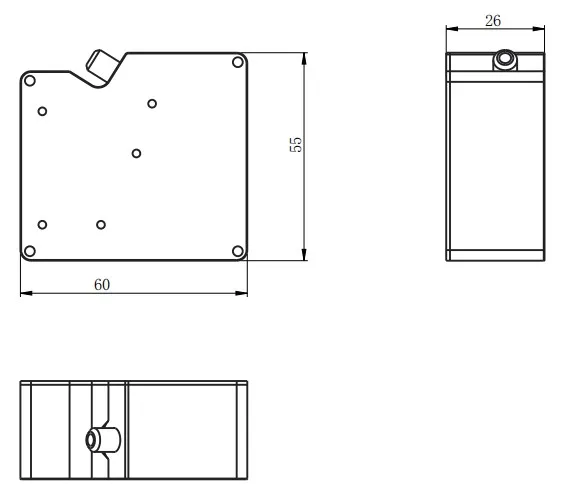
● ConstSpec-Mini400
Typical Application
● Raman Spectroscopy Measurement
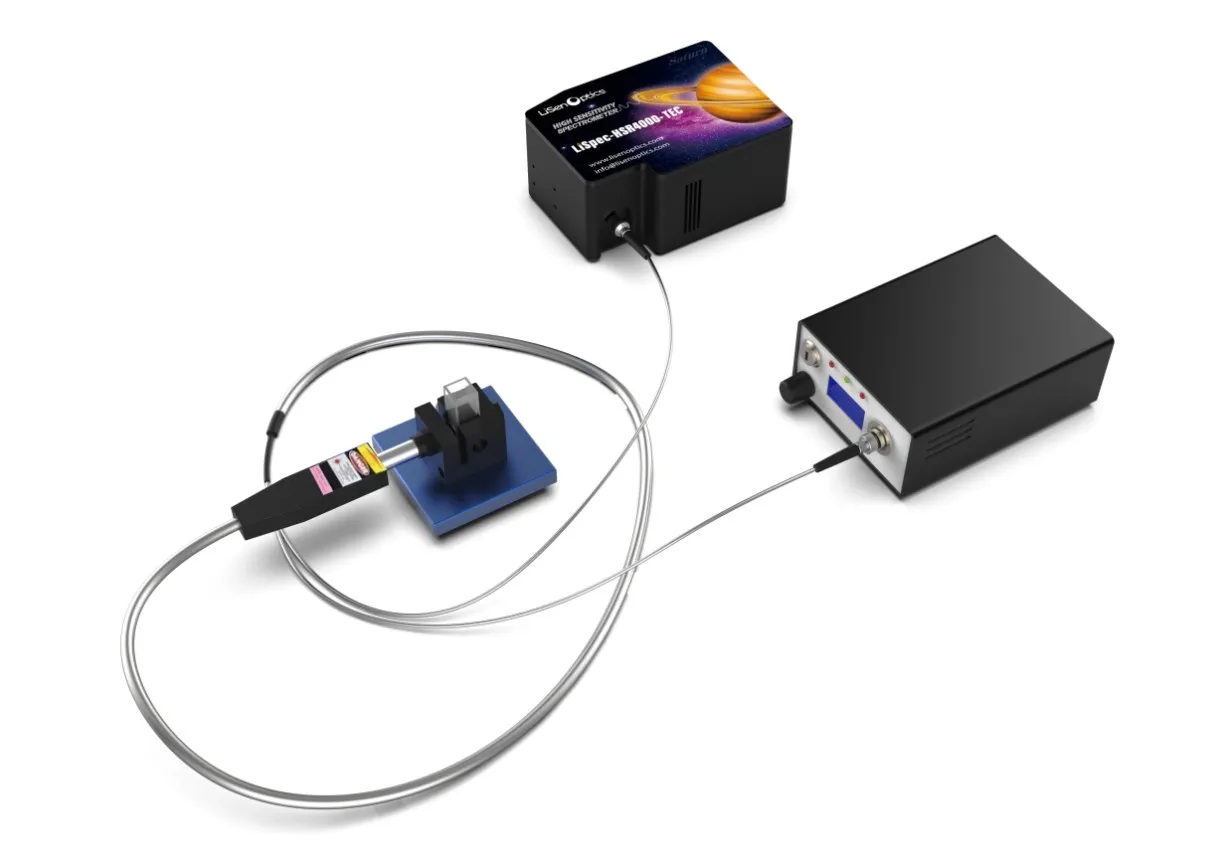
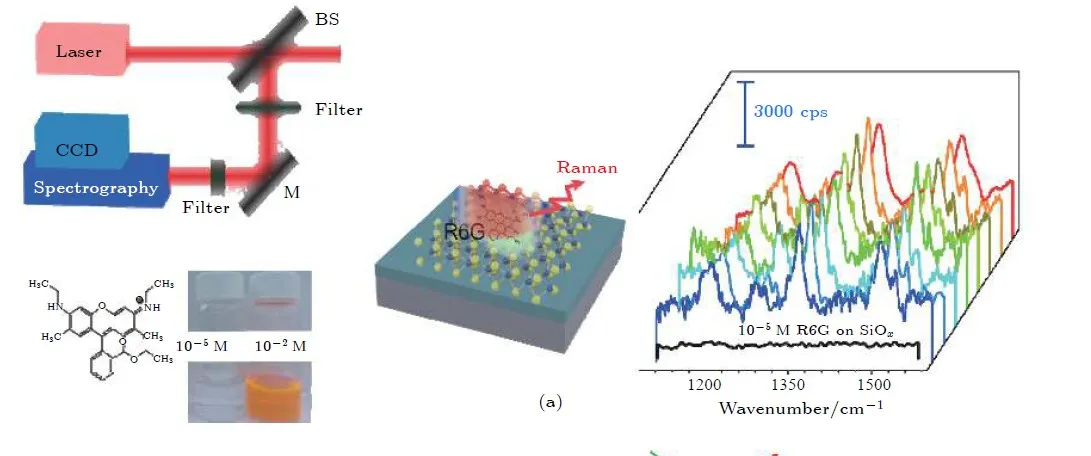
The Raman measurement system mainly consists of a spectrometer, a laser, a Raman probe, and Raman identification spectrum analysis software. Raman scattering is primarily Stokes and anti-Stokes, with Stokes Raman scattering usually much stronger than anti-Stokes scattering. Raman spectrometers typically measure Stokes scattering. Commonly used Raman spectrometers include 532/785/1064 Raman spectrometers. Raman measurements are generally an order of magnitude weaker than fluorescence signals. For weak Raman signal measurements, Surface-Enhanced Raman Scattering (SERS) is employed to amplify the Raman signal. LiSen Optics' LiSpec-UV series of industrial high-speed spectrometers, with their high sensitivity and high signal-to-noise ratio, can be paired with lasers and Raman probes to measure weak spectral signals, widely used in food safety, chemical laboratories, biology, and medical optics for the determination and confirmation of substance composition. They are also applicable in forensics for drug detection and in the jewelry industry for gemstone identification.
● Color Measurement
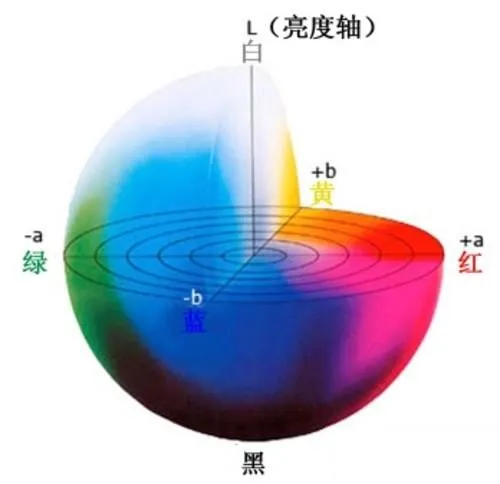
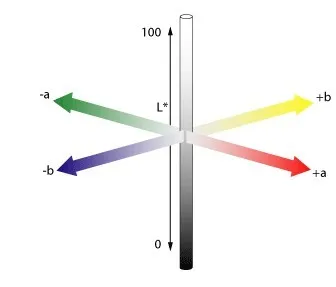
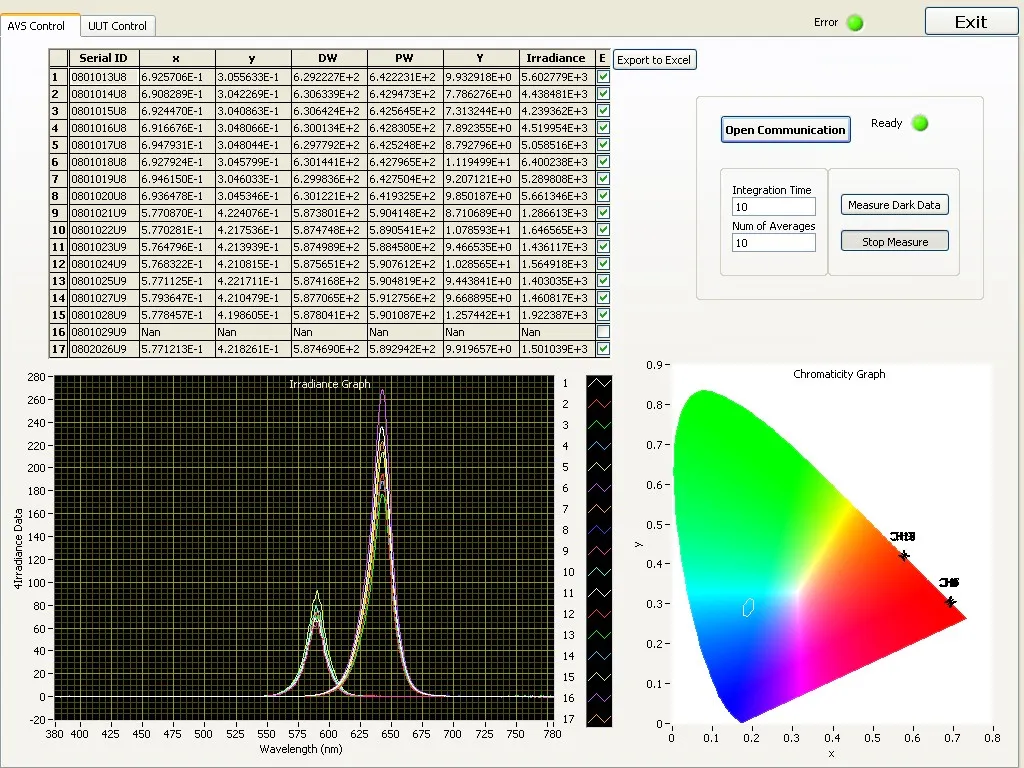
The color of an object can be described by the CIE1976 (Lab*) color space. L* represents the brightness of the color, positive a* values represent red, negative a* values represent green, hue, and chroma. Similarly, positive b* values represent yellow, and negative b* values represent blue. Lab* values can be derived from the CIE tristimulus values X, Y, Z of the sample (object) and the tristimulus values Xn, Yn, Zn of the standard light source. The tristimulus values X, Y, Z of an object's color are obtained by multiplying the relative power P of the standard light source, the reflectance R (or transmittance T) of the object, and the CIE standard observer functions Xλ,yλ,zλ (for 2 or 10-degree fields). Integrating these values over the visible spectrum range (from 380 to 780 nm, at 5 nm intervals) yields the tristimulus values. Professional color measurement software can compare the measured Lab* values with reference colors to calculate the color difference(△Elab,△L*,△a*,△b*).
 |
 |
● LED Color Measurement
● Radiation Measurement
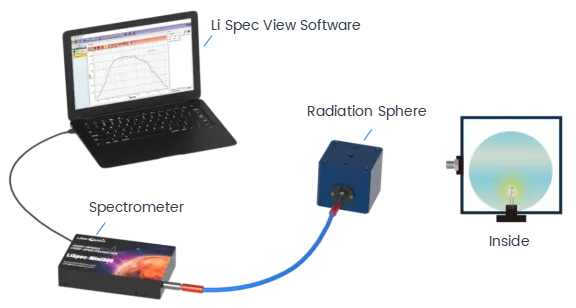
Radiant light energy can be quantified as radiant flux, which is a standard measure of the energy radiated per second (W) from a light source. Radiation measurements generally require absolute radiometric calibration of the spectrometer system with a standard light source of known spectral energy distribution. This calibration allows for radiation measurements through quantifiable parameters. Radiation energy related to human vision (photometry) can obtain the spectral luminous efficiency functions defined by the CIE, which represent the average vision of observers. Therefore, radiometric parameters, photometric parameters, and colorimetric parameters are defined in radiation measurement. Radiometric parameters mainly include irradiance μW/cm², radiance µWatt/sr, radiant flux µWatt, and photon count µMol/s/m², µMol/m², µMol/s, and µMol. Photometric parameters include lumens, illuminance Lux, and intensity Candela. Colorimetric parameters include X, Y, Z, x, y, z, u, v, color temperature, CRI color rendering index, etc.
● Irradiance Measurement
● Irradiance Measurement
The method of measuring absorbance with a spectrometer involves passing parallel light of a certain wavelength through a flat parallel sample and detecting the light transmitted through the sample. Since a portion of the energy is absorbed by molecules in the sample, the intensity of the detected incident light is higher than that transmitted through the sample. Absorbance is widely used in spectral measurement techniques for liquids and gases for quantitative identification of substances or fingerprint authentication. It can also be integrated into industrial applications and tests of interest to customers. Using LiSen Optics' modular spectrometers, specific absorbance measurements can be selected based on different wavelength ranges and resolutions. In the lab or field, the entire optical measurement setup can be quickly configured. Based on the high-quality spectrometers from LiSen Optics, a flexible and easy-to-use combination can be made by choosing UV light sources, different optical path gas chambers, absorption cells, specific absorption path modules, and fiber probes, offering a variety of configuration options for different absorbance tests.
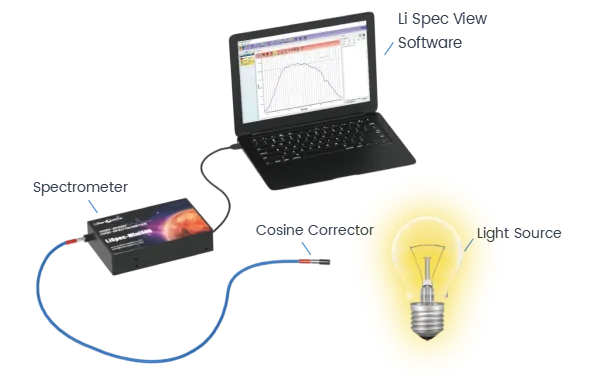
● Liquid Absorbance
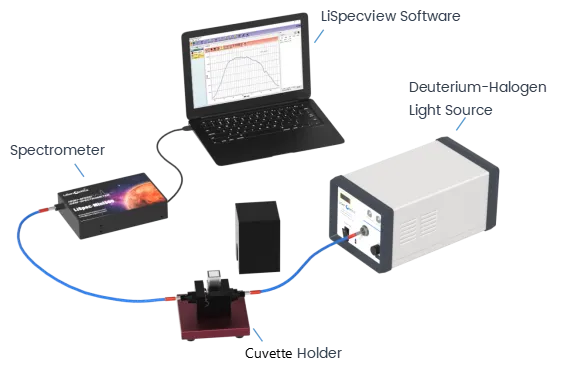
Absorbance Measurement (Cuvette)
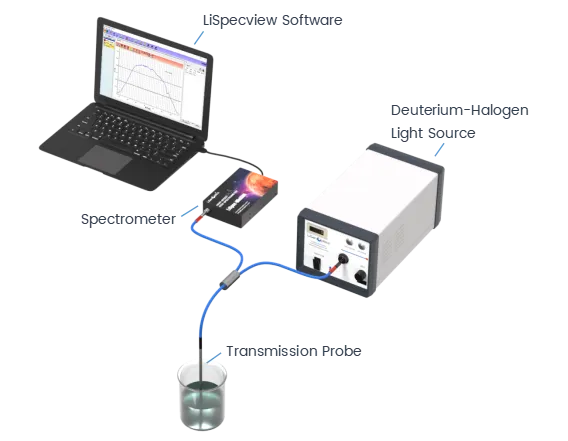
Absorbance Measurement (Fiber Probe)
● Gas Absorbance

● Thin Film Measurement
Thin film measurement systems are based on the principle of white light interferometry to determine the thickness of optical thin films. The thickness of the film is calculated through mathematical functions applied to the white light interference patterns. For a single-layer film, the physical thickness can be calculated if the refractive index (n) and extinction coefficient (k) of the film medium are known. The measurable film thickness ranges from 10 nm to 50 µm, with a resolution of up to 1 nm. Thin film measurement is applied in the semiconductor chip production industry, where it is necessary to monitor plasma etching and deposition processes. It can also be used in other fields requiring measurement of transparent film layers deposited on metal and glass substrates, such as transparent coatings on metal surfaces and glass substrates.
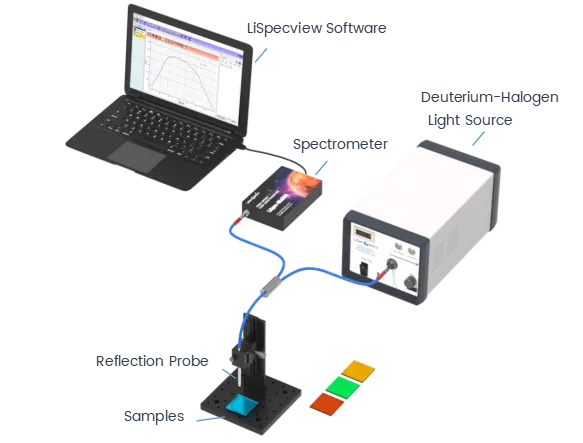
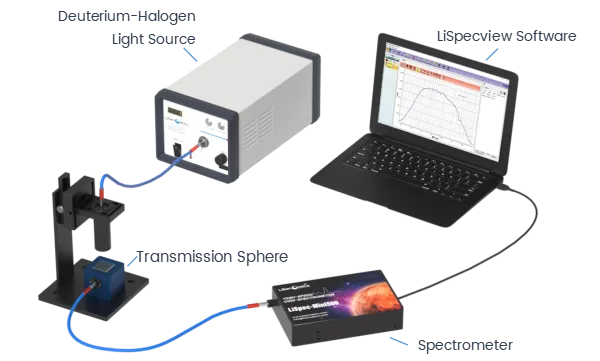
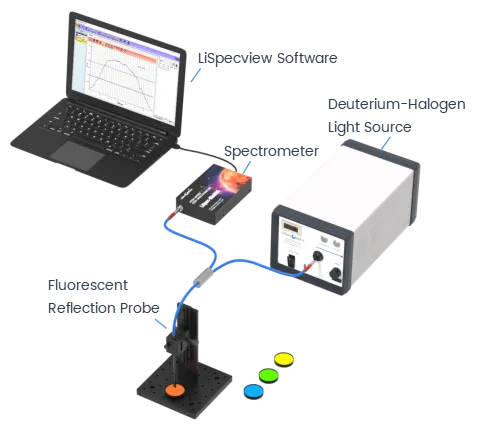
● Transmission/Reflection Spectral Measurement
With the booming industrial development, the quality control of the material characteristics has become increasingly strict. The technology of rapid and accurate transmission/reflection spectral measurements using fiber optic spectrometers is becoming more mature. Transmission/reflection spectral measurement is a basic method of spectral measurement, typically requiring equipment such as a spectrometer, light source, optical fiber, measurement stand, standard reference samples, and measurement software. To obtain better spectral data from different types of samples, these two basic modes may evolve into many more forms. Fiber optic spectrometers use optical fiber paths, overcoming the limitations of optical paths in instrument integration. LiSen Optics' fiber optic spectrometers are characterized by their small size, high stability, support for secondary software development, and a rich array of accessories, and have been successfully applied in the testing of industries such as glass and polymer materials. LiSen Optics provides users with spectral measurement equipment centered around spectrometers, and with these richly configured devices, various common spectral measurement systems can be easily set up.
Dimension (Unit: mm)
● ConstSpec-Mini400
● ConstSpec-Mini400
Typical Application
● Raman Spectroscopy Measurement
The Raman measurement system mainly consists of a spectrometer, a laser, a Raman probe, and Raman identification spectrum analysis software. Raman scattering is primarily Stokes and anti-Stokes, with Stokes Raman scattering usually much stronger than anti-Stokes scattering. Raman spectrometers typically measure Stokes scattering. Commonly used Raman spectrometers include 532/785/1064 Raman spectrometers. Raman measurements are generally an order of magnitude weaker than fluorescence signals. For weak Raman signal measurements, Surface-Enhanced Raman Scattering (SERS) is employed to amplify the Raman signal. LiSen Optics' LiSpec-UV series of industrial high-speed spectrometers, with their high sensitivity and high signal-to-noise ratio, can be paired with lasers and Raman probes to measure weak spectral signals, widely used in food safety, chemical laboratories, biology, and medical optics for the determination and confirmation of substance composition. They are also applicable in forensics for drug detection and in the jewelry industry for gemstone identification.
● Color Measurement
The color of an object can be described by the CIE1976 (Lab*) color space. L* represents the brightness of the color, positive a* values represent red, negative a* values represent green, hue, and chroma. Similarly, positive b* values represent yellow, and negative b* values represent blue. Lab* values can be derived from the CIE tristimulus values X, Y, Z of the sample (object) and the tristimulus values Xn, Yn, Zn of the standard light source. The tristimulus values X, Y, Z of an object's color are obtained by multiplying the relative power P of the standard light source, the reflectance R (or transmittance T) of the object, and the CIE standard observer functions Xλ,yλ,zλ (for 2 or 10-degree fields). Integrating these values over the visible spectrum range (from 380 to 780 nm, at 5 nm intervals) yields the tristimulus values. Professional color measurement software can compare the measured Lab* values with reference colors to calculate the color difference(△Elab,△L*,△a*,△b*).
|
|
● LED Color Measurement
● Radiation Measurement
Radiant light energy can be quantified as radiant flux, which is a standard measure of the energy radiated per second (W) from a light source. Radiation measurements generally require absolute radiometric calibration of the spectrometer system with a standard light source of known spectral energy distribution. This calibration allows for radiation measurements through quantifiable parameters. Radiation energy related to human vision (photometry) can obtain the spectral luminous efficiency functions defined by the CIE, which represent the average vision of observers. Therefore, radiometric parameters, photometric parameters, and colorimetric parameters are defined in radiation measurement. Radiometric parameters mainly include irradiance μW/cm², radiance µWatt/sr, radiant flux µWatt, and photon count µMol/s/m², µMol/m², µMol/s, and µMol. Photometric parameters include lumens, illuminance Lux, and intensity Candela. Colorimetric parameters include X, Y, Z, x, y, z, u, v, color temperature, CRI color rendering index, etc.
● Irradiance Measurement
● Irradiance Measurement
The method of measuring absorbance with a spectrometer involves passing parallel light of a certain wavelength through a flat parallel sample and detecting the light transmitted through the sample. Since a portion of the energy is absorbed by molecules in the sample, the intensity of the detected incident light is higher than that transmitted through the sample. Absorbance is widely used in spectral measurement techniques for liquids and gases for quantitative identification of substances or fingerprint authentication. It can also be integrated into industrial applications and tests of interest to customers. Using LiSen Optics' modular spectrometers, specific absorbance measurements can be selected based on different wavelength ranges and resolutions. In the lab or field, the entire optical measurement setup can be quickly configured. Based on the high-quality spectrometers from LiSen Optics, a flexible and easy-to-use combination can be made by choosing UV light sources, different optical path gas chambers, absorption cells, specific absorption path modules, and fiber probes, offering a variety of configuration options for different absorbance tests.
● Liquid Absorbance
Absorbance Measurement (Cuvette)
Absorbance Measurement (Fiber Probe)
● Gas Absorbance
● Thin Film Measurement
Thin film measurement systems are based on the principle of white light interferometry to determine the thickness of optical thin films. The thickness of the film is calculated through mathematical functions applied to the white light interference patterns. For a single-layer film, the physical thickness can be calculated if the refractive index (n) and extinction coefficient (k) of the film medium are known. The measurable film thickness ranges from 10 nm to 50 µm, with a resolution of up to 1 nm. Thin film measurement is applied in the semiconductor chip production industry, where it is necessary to monitor plasma etching and deposition processes. It can also be used in other fields requiring measurement of transparent film layers deposited on metal and glass substrates, such as transparent coatings on metal surfaces and glass substrates.
● Transmission/Reflection Spectral Measurement
With the booming industrial development, the quality control of the material characteristics has become increasingly strict. The technology of rapid and accurate transmission/reflection spectral measurements using fiber optic spectrometers is becoming more mature. Transmission/reflection spectral measurement is a basic method of spectral measurement, typically requiring equipment such as a spectrometer, light source, optical fiber, measurement stand, standard reference samples, and measurement software. To obtain better spectral data from different types of samples, these two basic modes may evolve into many more forms. Fiber optic spectrometers use optical fiber paths, overcoming the limitations of optical paths in instrument integration. LiSen Optics' fiber optic spectrometers are characterized by their small size, high stability, support for secondary software development, and a rich array of accessories, and have been successfully applied in the testing of industries such as glass and polymer materials. LiSen Optics provides users with spectral measurement equipment centered around spectrometers, and with these richly configured devices, various common spectral measurement systems can be easily set up.
● Reflectance Measurement
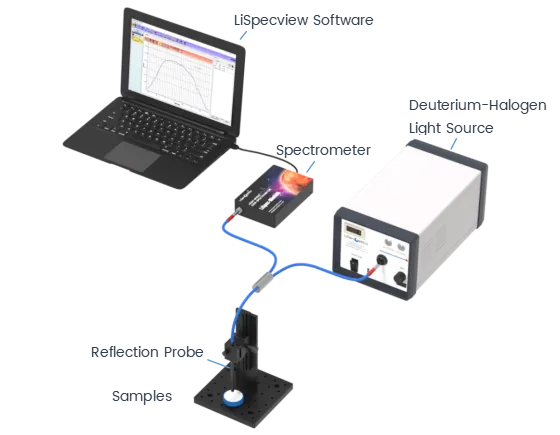
Reflectance Measurement(Probe)
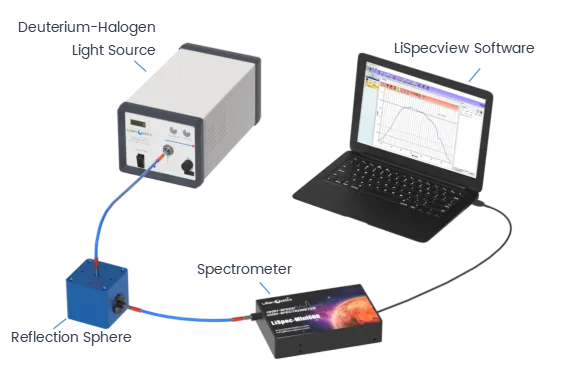
Reflectance Measurement (Integrating Sphere)
● Transmittance Measurement
● Fluorescence Spectral Measurement
Fluorescent substances emit radiation with a certain spectral distribution under the radiation energy of specific wavelengths, usually scattering energy radiation in all directions. The fluorescence energy generated in fluorescence spectral measurement is less than the energy of the photons of the excitation light, only about 3% of the excitation light energy. It has high sensitivity, strong selectivity, requires small sample quantities, is simple to use, and is environmentally friendly. It is widely used in engineering applications such as monitoring food safety in food processing, fluorescence diagnosis of lesions in biomedical applications, exploration of oil minerals in geology, determination of soil mineral composition, and detection of trace elements in substances. LiSen Optics' fiber optic spectrometers feature interchangeable slits, selectable wavelength ranges, and resolution design, allowing customers to freely configure and match the fluorescence measurement system with suitable parameters according to their needs.
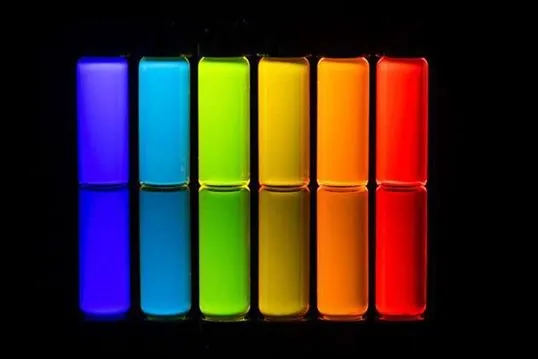
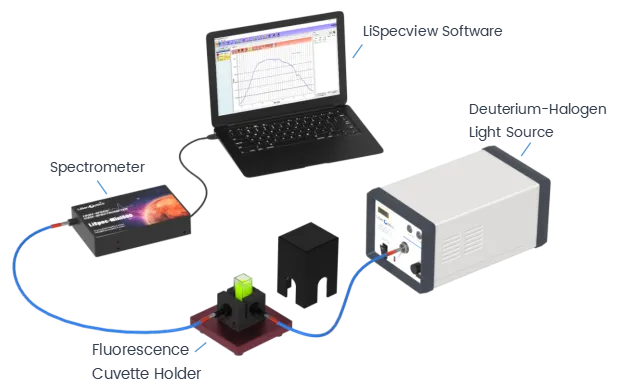
Fluorescence Measurement (Liquid)
Fluorescence Measurement (Powder, Solid)
● Reflectance Measurement
Reflectance Measurement(Probe)
Reflectance Measurement (Integrating Sphere)
● Transmittance Measurement
● Fluorescence Spectral Measurement
Fluorescent substances emit radiation with a certain spectral distribution under the radiation energy of specific wavelengths, usually scattering energy radiation in all directions. The fluorescence energy generated in fluorescence spectral measurement is less than the energy of the photons of the excitation light, only about 3% of the excitation light energy. It has high sensitivity, strong selectivity, requires small sample quantities, is simple to use, and is environmentally friendly. It is widely used in engineering applications such as monitoring food safety in food processing, fluorescence diagnosis of lesions in biomedical applications, exploration of oil minerals in geology, determination of soil mineral composition, and detection of trace elements in substances. LiSen Optics' fiber optic spectrometers feature interchangeable slits, selectable wavelength ranges, and resolution design, allowing customers to freely configure and match the fluorescence measurement system with suitable parameters according to their needs.
Fluorescence Measurement (Liquid)
Fluorescence Measurement (Powder, Solid)
Get Your Free Spectral Analysis Solution.
Tell us about your requirements. Our experts will contact you within 24 hours.
Focus on spectral sensing and optoelectronic application systems