Get Your Free Spectral Analysis Solution.
Tell us about your requirements. Our experts will contact you within 24 hours.
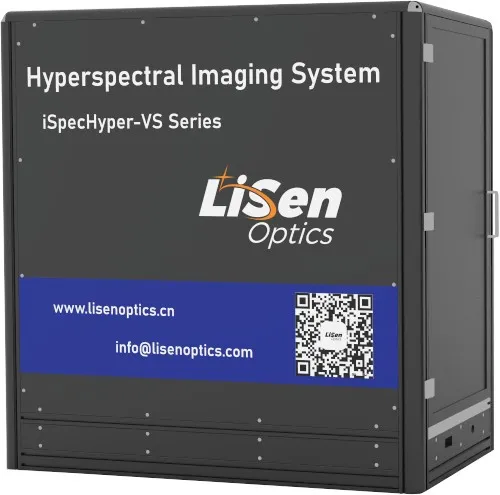
The iSpecHyper-VS1000-Lab, the latest star product from LiSen Optics, is a user-friendly, configurable, and portable high-spectral imaging system. Its primary advantages include an exclusive high-throughput spectral design, high signal-to-noise sensitivity, large target surface detectors, and superior image quality.
The iSpecHyper-VS1000-Lab lab hyperspectral imaging system employs a principle of internal push-broom scanning through a transmission grating. The system integrates a high-performance data acquisition and analysis processing system, high-speed USB 3.0 transmission, and an optical design for full-target high-quality imaging. With a standard C-Mount for the objective interface, field lenses can be exchanged according to user needs. The iSpecHyper-VS1000 has widespread applications in various fields such as public security and criminal investigation, forensic identification, precision agriculture and forestry, remote sensing and telemetry, industrial inspection, medical care, mining exploration, and more.
Technical Advantages and Features
● Spectral range of 400-1000nm/900-1700nm, with a resolution better than 2.5nm
● Exclusive design for high light flux spectroscopic imaging, with high signal-to-noise sensitivity
● 24mm/35mm lens with electrically controlled automatic focusing technology, automatic exposure, automatic image scanning matching, laser positioning and ranging
● High frame rate, auxiliary camera for real-time monitoring through transparency, built-in lithium battery eliminates the need for an additional power supply
● Optical design for full-target high-quality imaging, with a spot line spot diameter smaller than 0.5 pixels
● Data format compatibility with analysis software like ENVI, support for multiple ROIs, and interchangeable lenses
 |
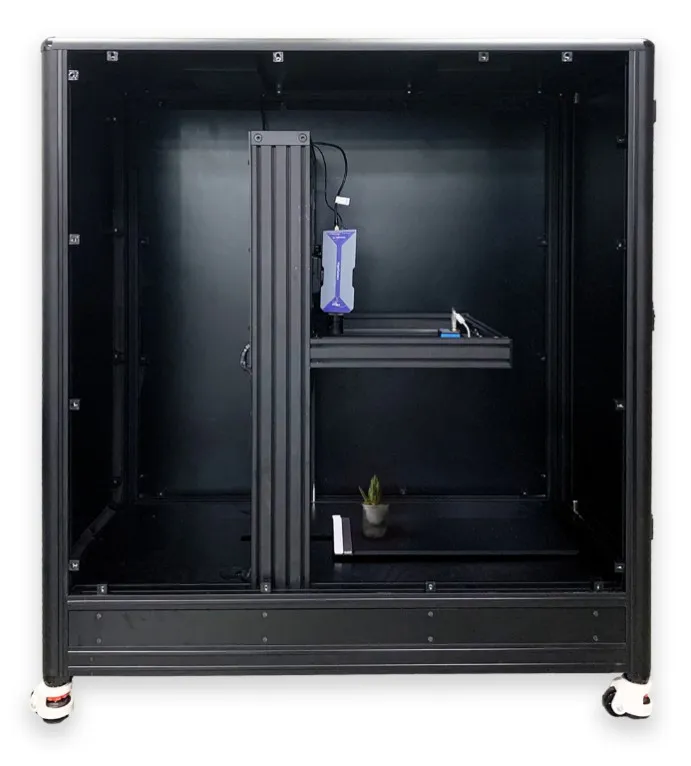 |
Lab Hyperspectral Imaging System Concept Sample Diagram
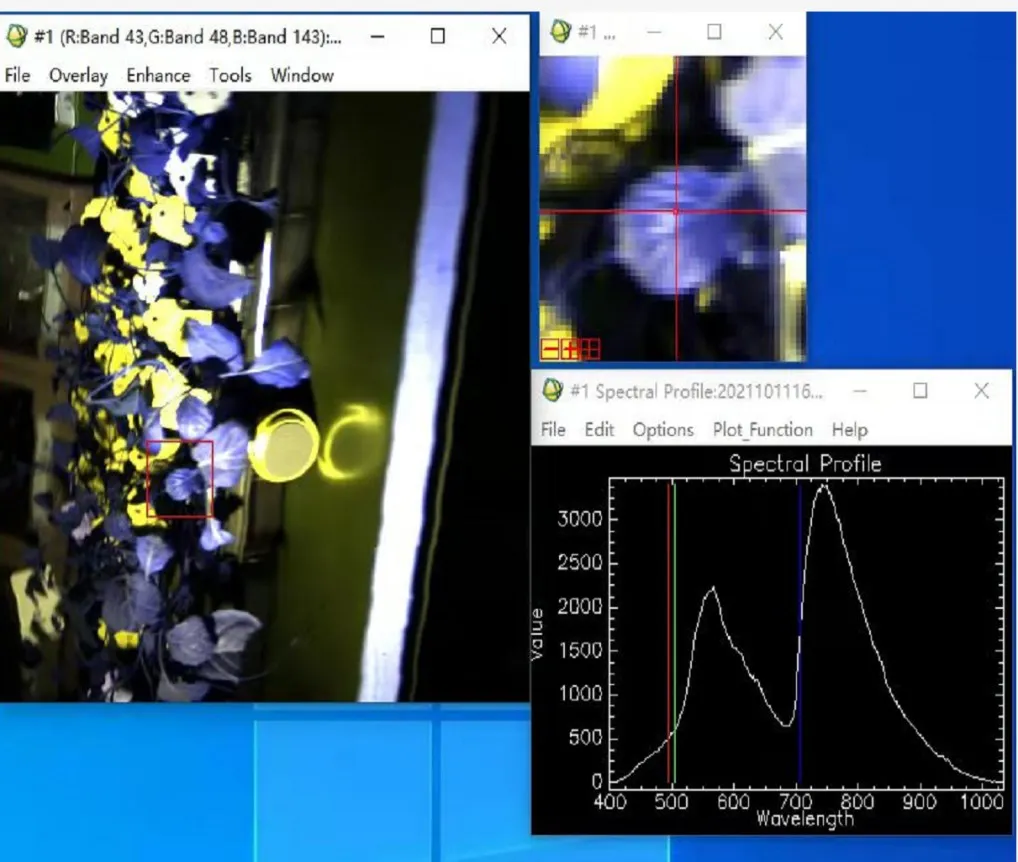
Software’s UI
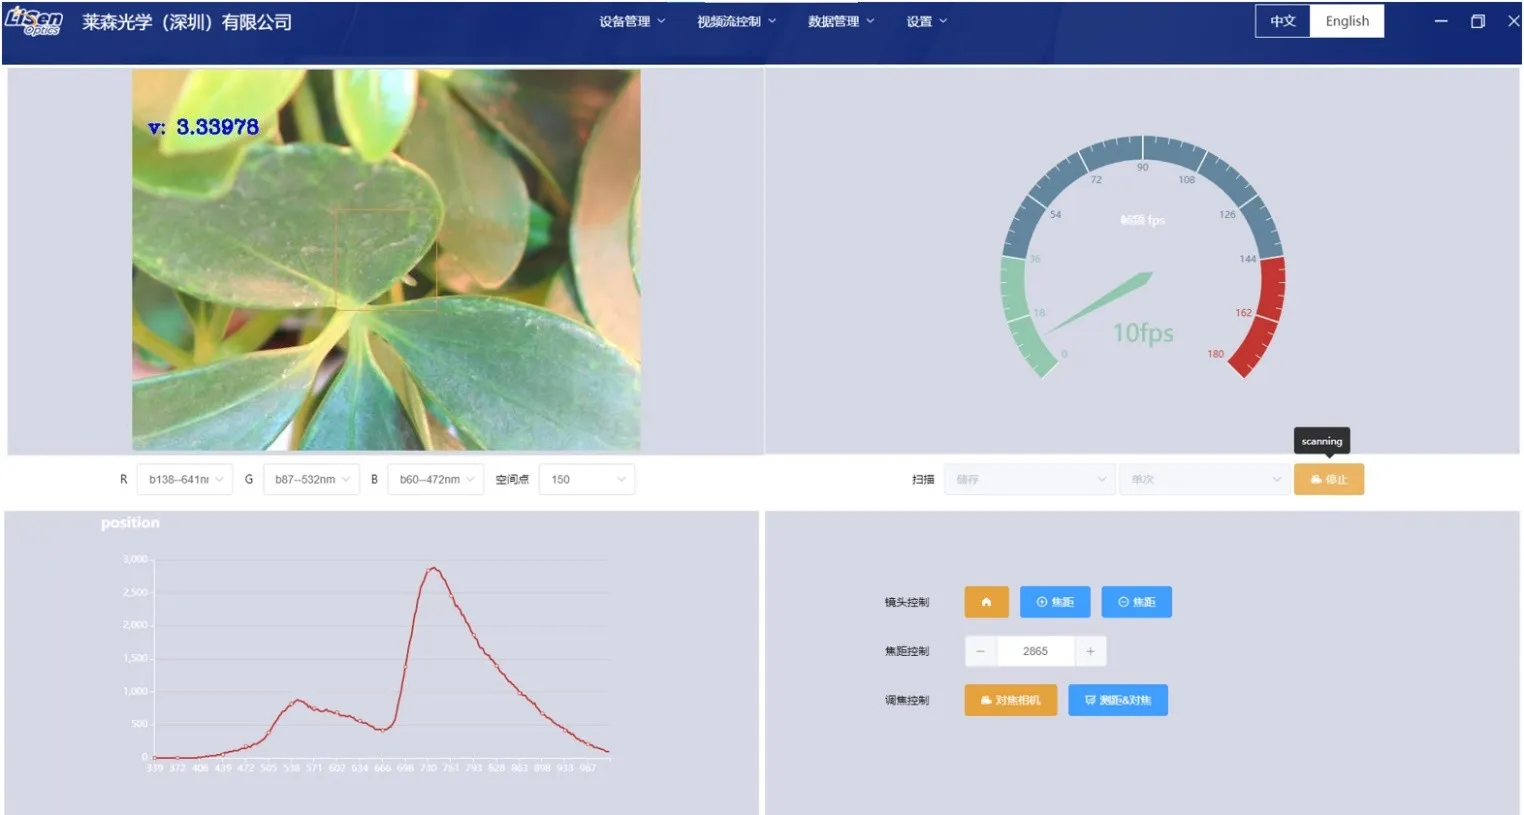
Software’s UI
Main Technical Indicators
|
Model |
iSpecHyper-VS1000-Lab |
|
Spectral Range |
400-1000nm |
|
Spectral Resolution |
Better than 2.5nm |
|
High Performance Uniformity Light Source |
350-2500nm |
|
Imaging Mode |
External Push-broom |
|
Spatial Reflectance Reference Panels |
3%、50% |
|
Time Reflectance Reference Panels |
50% |
|
Scanning Range |
220*300mm |
|
Sample Thickness |
0-100mm |
|
Software |
Data Acquisition and Control System |
|
Camera |
5 Megapixels |
|
Data Acquisition System |
iSpecHyper-View |
|
CPU:I5,Memory:16G,Hard disk:512G |
|
|
Accessories List |
High-performance Solar Uniform Light Source, Diffuse Reflectance Standard Reference Panels (3%/50%), Linear Displacement, Integrated Hyperspectral System Dark Box, External Laptop Computer, Supporting Data Cables. |
|
Model |
iSpecHyper-VS2000-Lab-SCE |
iSpecHyper-VS2000-Lab-PRO |
|
|
Spectral Range |
900-1700nm |
||
|
Spectral Resolution |
Better than 5nm |
||
|
Spatial Resolution |
0.85mrad@f=35mm |
||
|
Field of View |
15.6°@F=35mm |
||
|
Spatial Channels |
320 |
640 |
|
|
Spectral Channels |
256 |
512 |
|
|
Detector Type |
InGaAs(TE Cooled) |
||
|
Detector Interface |
GigE |
CameraLink |
|
|
Detector Array |
9.6mm x 7.68mm |
||
|
Detector Native Resolution |
320*256 |
640*512 |
|
|
Detector Native Pixel Size |
30 µm x30 µm |
15 µm x15 µm |
|
|
Bit Depth |
14 bits |
||
|
Frame Rate |
Full Spectral Range Acquisition with 100fps max |
Full Spectral Range Acquisition with 300fps max |
|
|
Imaging Mode |
External Push-broom |
||
|
Scanning Range |
220X500mm |
||
|
High-Definition Camera Pixels |
24 Megapixels |
24 Megapixels |
|
|
Data Acquisition System |
iSpecHyper-View |
||
|
CPU:I5,Memory:16G,Hard disk:512G |
|||
|
Main Unit |
Box-type Light Shielding Dark Box |
||
|
Accessories List |
High-Performance Solar Uniform Light Source, |
High-Performance Linear Focusing Light Source. Diffuse Reflectance Standard Reference Panels (3%/50%) Linear Displacement Stage, Integrated Hyperspectral System Dark Box, External Laptop Computer, Matching Data Cables. |
|
|
Diffuse Reflectance Standard Reference Panels (3%/50%) Linear Displacement Stage, Integrated Hyperspectral System Dark Box, External Laptop Computer, Matching Data Cables. |
|||
Technical Advantages and Features
● Spectral range of 400-1000nm/900-1700nm, with a resolution better than 2.5nm
● Exclusive design for high light flux spectroscopic imaging, with high signal-to-noise sensitivity
● 24mm/35mm lens with electrically controlled automatic focusing technology, automatic exposure, automatic image scanning matching, laser positioning and ranging
● High frame rate, auxiliary camera for real-time monitoring through transparency, built-in lithium battery eliminates the need for an additional power supply
● Optical design for full-target high-quality imaging, with a spot line spot diameter smaller than 0.5 pixels
● Data format compatibility with analysis software like ENVI, support for multiple ROIs, and interchangeable lenses
|
|
Lab Hyperspectral Imaging System Concept Sample Diagram
Software’s UI
Software’s UI
Main Technical Indicators
|
Model |
iSpecHyper-VS1000-Lab |
|
Spectral Range |
400-1000nm |
|
Spectral Resolution |
Better than 2.5nm |
|
High Performance Uniformity Light Source |
350-2500nm |
|
Imaging Mode |
External Push-broom |
|
Spatial Reflectance Reference Panels |
3%、50% |
|
Time Reflectance Reference Panels |
50% |
|
Scanning Range |
220*300mm |
|
Sample Thickness |
0-100mm |
|
Software |
Data Acquisition and Control System |
|
Camera |
5 Megapixels |
|
Data Acquisition System |
iSpecHyper-View |
|
CPU:I5,Memory:16G,Hard disk:512G |
|
|
Accessories List |
High-performance Solar Uniform Light Source, Diffuse Reflectance Standard Reference Panels (3%/50%), Linear Displacement, Integrated Hyperspectral System Dark Box, External Laptop Computer, Supporting Data Cables. |
|
Model |
iSpecHyper-VS2000-Lab-SCE |
iSpecHyper-VS2000-Lab-PRO |
|
|
Spectral Range |
900-1700nm |
||
|
Spectral Resolution |
Better than 5nm |
||
|
Spatial Resolution |
0.85mrad@f=35mm |
||
|
Field of View |
15.6°@F=35mm |
||
|
Spatial Channels |
320 |
640 |
|
|
Spectral Channels |
256 |
512 |
|
|
Detector Type |
InGaAs(TE Cooled) |
||
|
Detector Interface |
GigE |
CameraLink |
|
|
Detector Array |
9.6mm x 7.68mm |
||
|
Detector Native Resolution |
320*256 |
640*512 |
|
|
Detector Native Pixel Size |
30 µm x30 µm |
15 µm x15 µm |
|
|
Bit Depth |
14 bits |
||
|
Frame Rate |
Full Spectral Range Acquisition with 100fps max |
Full Spectral Range Acquisition with 300fps max |
|
|
Imaging Mode |
External Push-broom |
||
|
Scanning Range |
220X500mm |
||
|
High-Definition Camera Pixels |
24 Megapixels |
24 Megapixels |
|
|
Data Acquisition System |
iSpecHyper-View |
||
|
CPU:I5,Memory:16G,Hard disk:512G |
|||
|
Main Unit |
Box-type Light Shielding Dark Box |
||
|
Accessories List |
High-Performance Solar Uniform Light Source, |
High-Performance Linear Focusing Light Source. Diffuse Reflectance Standard Reference Panels (3%/50%) Linear Displacement Stage, Integrated Hyperspectral System Dark Box, External Laptop Computer, Matching Data Cables. |
|
|
Diffuse Reflectance Standard Reference Panels (3%/50%) Linear Displacement Stage, Integrated Hyperspectral System Dark Box, External Laptop Computer, Matching Data Cables. |
|||
![]() Typical Application Examples of Hyperspectral Technology
Typical Application Examples of Hyperspectral Technology
● Hyperspectral Technology’s Application in Fruit Sorting
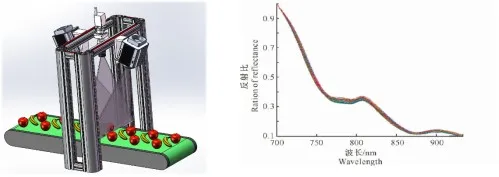 With the development of China's agricultural processing industry and the acceleration of agricultural modernization, the importance and urgency of quality inspection and grading techniques for agricultural products, including fruits, have increased. The internal quality of fruits represents their physiological, chemical, and physical properties. Hyperspectral imaging systems have now begun to be applied in fruit sorting, where the spectral information reflecting fruit quality is mainly concentrated between 650nm and 950nm. The sugar content of fruits is an important factor determining the spectral quality, with sugar spectral features mainly observed in the absorption range of 700nm-820nm and peaks around 750nm and 800-900nm.
In fruit sorting using hyperspectral imaging systems, industrial conveyor belts are utilized as the mechanism for the push-broom imaging of the hyperspectral camera. The hyperspectral camera is mounted on a gantry structure above the conveyor belt, and a dedicated linear light source is used for illumination. The system mainly consists of the hyperspectral camera and its support structure, a linear light source, a control module, position sensors, and a computer running control and data acquisition software.
This setup allows for the acquisition and analysis of hyperspectral data of fruits during the sorting process, enabling real-time assessment of their internal quality characteristics. By combining the spectral information with image processing algorithms, the system can accurately classify and grade fruits based on their internal quality parameters, improving the efficiency and consistency of fruit sorting in the agricultural processing industry.
● Hyperspectral Technology’s Application in Blood Oxygen Content Detection
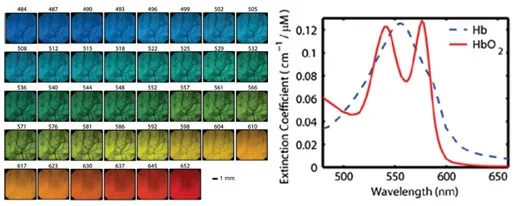
The paper titled "Hyperspectral optical tomography of intrinsic signals in the rat cortex" published in 2015 investigated the application of hyperspectral imaging in the rat cortex. The researchers discovered that oxygenated hemoglobin and deoxygenated hemoglobin exhibited sensitive variations at 529nm and 630nm, respectively. Considering the flexibility and versatility of data algorithms in hyperspectral technology, the authors developed a novel hyperspectral algorithm called DOT (Diffuse Optical Tomography) for convenient and rapid assessment of oxygen saturation in blood.
The DOT algorithm, combined with hyperspectral imaging data, utilizes the analysis of spectral characteristics and hemoglobin absorption changes at different wavelengths to provide a non-invasive method for inferring changes in oxygen content in the blood. This approach facilitates a better understanding of blood supply and metabolism in the cortical regions of the brain, offering valuable insights for studying brain function and related pathologies.
The study highlights the application of hyperspectral imaging in conjunction with the DOT algorithm as a new tool and method for investigating the relationship between brain activity and blood supply. By monitoring changes in blood oxygenation in the cortical areas of the brain, a deeper understanding of the physiological processes and pathological mechanisms underlying neural activity can be achieved.
![]() Typical Application Examples of Hyperspectral Technology
Typical Application Examples of Hyperspectral Technology
● Hyperspectral Technology’s Application in Fruit Sorting
With the development of China's agricultural processing industry and the acceleration of agricultural modernization, the importance and urgency of quality inspection and grading techniques for agricultural products, including fruits, have increased. The internal quality of fruits represents their physiological, chemical, and physical properties. Hyperspectral imaging systems have now begun to be applied in fruit sorting, where the spectral information reflecting fruit quality is mainly concentrated between 650nm and 950nm. The sugar content of fruits is an important factor determining the spectral quality, with sugar spectral features mainly observed in the absorption range of 700nm-820nm and peaks around 750nm and 800-900nm.
In fruit sorting using hyperspectral imaging systems, industrial conveyor belts are utilized as the mechanism for the push-broom imaging of the hyperspectral camera. The hyperspectral camera is mounted on a gantry structure above the conveyor belt, and a dedicated linear light source is used for illumination. The system mainly consists of the hyperspectral camera and its support structure, a linear light source, a control module, position sensors, and a computer running control and data acquisition software.
This setup allows for the acquisition and analysis of hyperspectral data of fruits during the sorting process, enabling real-time assessment of their internal quality characteristics. By combining the spectral information with image processing algorithms, the system can accurately classify and grade fruits based on their internal quality parameters, improving the efficiency and consistency of fruit sorting in the agricultural processing industry.
● Hyperspectral Technology’s Application in Blood Oxygen Content Detection
The paper titled "Hyperspectral optical tomography of intrinsic signals in the rat cortex" published in 2015 investigated the application of hyperspectral imaging in the rat cortex. The researchers discovered that oxygenated hemoglobin and deoxygenated hemoglobin exhibited sensitive variations at 529nm and 630nm, respectively. Considering the flexibility and versatility of data algorithms in hyperspectral technology, the authors developed a novel hyperspectral algorithm called DOT (Diffuse Optical Tomography) for convenient and rapid assessment of oxygen saturation in blood.
The DOT algorithm, combined with hyperspectral imaging data, utilizes the analysis of spectral characteristics and hemoglobin absorption changes at different wavelengths to provide a non-invasive method for inferring changes in oxygen content in the blood. This approach facilitates a better understanding of blood supply and metabolism in the cortical regions of the brain, offering valuable insights for studying brain function and related pathologies.
The study highlights the application of hyperspectral imaging in conjunction with the DOT algorithm as a new tool and method for investigating the relationship between brain activity and blood supply. By monitoring changes in blood oxygenation in the cortical areas of the brain, a deeper understanding of the physiological processes and pathological mechanisms underlying neural activity can be achieved.
● Hyperspectral Technology’s Application in Photosynthesis Research
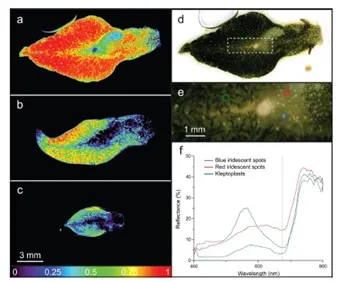
The paper titled "Kleptoplast photosynthesis is nutritionally relevant in the sea slug Elysia viridis," published in 2017, investigated the phenomenon of "photosynthesis" in sea slugs. These sea slugs feed on large algae and incorporate the algal chloroplasts into their renal tubule cells. Researchers utilized hyperspectral imaging to study the abundance, distribution, and photosynthetic mechanisms of the chloroplasts within the sea slugs. It was observed that after 24 days of dark starvation, the chloroplasts within the sea slugs significantly decreased in number. This suggests that under extremely adverse conditions, the chloroplasts within the sea slugs can undergo degradation to meet their energy requirements.
● Hyperspectral Technology’s Application in Biomedical
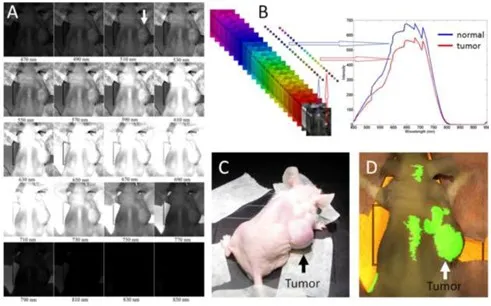
The paper titled "Hyperspectral imaging and spectral-spatial classification for cancer detection," published in 2012, introduces hyperspectral imaging as an emerging technology for biomedical applications. The study proposes an advanced image processing and classification method for analyzing hyperspectral image data in prostate cancer detection. A least squares support vector machine (LS-SVM) is developed and evaluated for classifying hyperspectral data to enhance the detection of cancerous tissue. The method is applied to detect prostate cancer in tumor-bearing mice. Spatially resolved images are created to highlight the differences in reflectance characteristics between cancerous and normal tissues. Preliminary results in mice demonstrate that hyperspectral imaging and classification methods can reliably detect prostate tumors in animal models. Hyperspectral imaging technology provides a new tool for optical diagnosis of cancer.
In separate studies by Houzhu Ding et al. (2015) and Michael S. Chin et al. (2015), pigs and nude mice were used as experimental animals for hyperspectral imaging research on burn classification and recovery. The left image shows the distribution of oxygen saturation and hemoglobin in burn areas obtained through hyperspectral imaging analysis. T00, T01, T04, T24 represent the time points of 0 hours, 1 hour, 4 hours, and 24 hours after the burn, respectively. The right image consists of a color image of burned skin in nude mice, an image of oxygenated hemoglobin obtained through hyperspectral imaging analysis, and a tissue section. Hyperspectral imaging enables non-destructive, non-contact, and high-throughput grading of burn depth.
These studies demonstrate the potential of hyperspectral imaging in biomedical research, particularly in cancer detection and burn assessment, by leveraging the spectral and spatial information provided by this technology. The combination of hyperspectral imaging and advanced analysis methods offers valuable insights into disease diagnosis, monitoring, and treatment evaluation.
● Hyperspectral Technology’s Application in Biological Classification
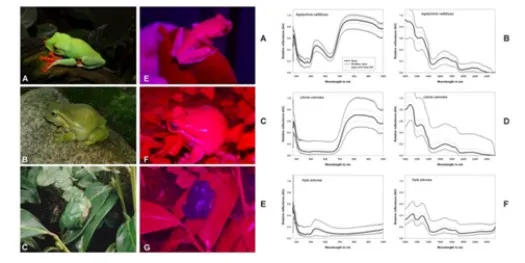
The paper titled "Non-Invasive Measurement of Frog Skin Reflectivity in High Spatial Resolution Using a Dual Hyperspectral Approach," published in 2013, investigated the spectral reflectance of three species of arboreal frogs using a dual-camera setup composed of two push-broom hyperspectral imaging systems. The systems generated reflectance images between 400 and 2500nm. The researchers analyzed the spectral reflectance of the frogs' skin.
All three species of tree frogs exhibited a visually observable green coloration. However, significant differences in spectral reflectance between the species were observed between 700 and 1100nm, allowing for species differentiation.
In this study, the dual hyperspectral imaging approach provided high spatial resolution and a wide spectral range for analyzing the frog skin reflectivity. The findings highlight the potential of hyperspectral imaging in non-invasively studying the spectral properties of frog skin, particularly in discerning different species based on their distinctive spectral reflectance patterns.
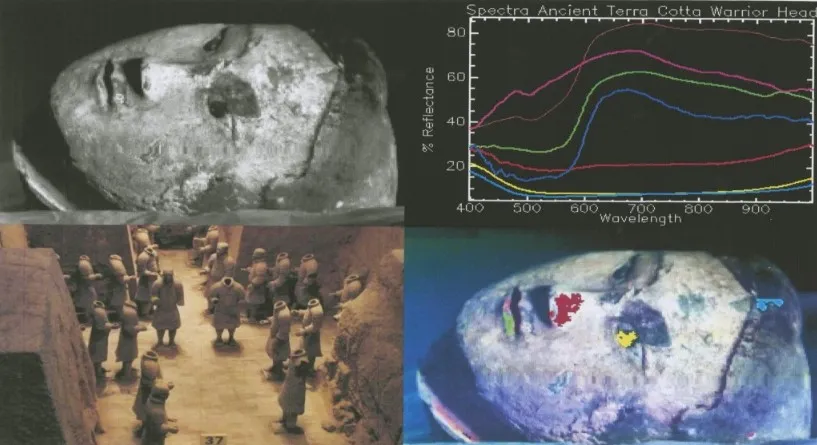
● Hyperspectral Technology’s Application in Archaeology of Cultural Heritage
Since the discovery of the Terracotta Warriors and Horses in 1974, they have garnered worldwide attention and have been hailed as the "Eighth Wonder of the World" by former French President Jacques Chirac. However, these precious cultural relics, including the Terracotta Warriors, have been buried underground for over two thousand years and are suddenly exposed to the air, making them highly susceptible to changes and posing significant challenges in terms of restoration and preservation.
Hyperspectral imaging technology enables the non-contact acquisition of image spectral information from the Terracotta Warriors. By analyzing the images and spectral information of the Terracotta Warriors, one can assess the extent of deterioration caused by diseases and determine the pigments used in their production. Based on the analysis results, simulated restoration can be performed.
The utilization of hyperspectral imaging technology in the restoration and preservation of the Terracotta Warriors provides valuable insights into their condition and assists in developing appropriate restoration strategies. This technology allows for non-invasive examination and documentation of the Terracotta Warriors' surface features, pigments, and deterioration patterns. By understanding the extent of damage and the original coloring materials, experts can make informed decisions regarding the restoration process.
The application of hyperspectral imaging technology not only contributes to the restoration of the Terracotta Warriors but also serves as a significant advancement in the field of cultural heritage preservation. It offers a scientific and efficient approach to studying and conserving cultural relics, ensuring their longevity and the transmission of historical and artistic values to future generations.
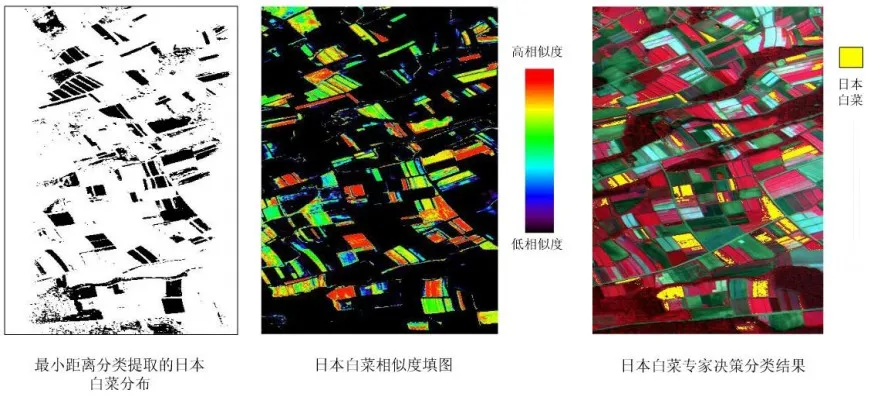
● Hyperspectral Technology’s Application in Fine Crop Classification and Recognition
Hyperspectral data can distinguish more subtle spectral differences in crops and detect changes in a narrower spectral range, enabling accurate detailed classification and information extraction of crops. Currently, the most popular and widely applied methods for hyperspectral crop classification include Spectral Angle Mapper (SAM) and Decision Tree-based hierarchical classification.
Based on hyperspectral imagery, Xiong Zhen from the Institute of Remote Sensing and Digital Earth of the Chinese Academy of Sciences monitored the growth stages of rice in Changzhou. A hybrid decision tree method was employed for precise classification of rice varieties using hyperspectral images. The classification achieved an accuracy of 94.9% for distinguishing six rice varieties.
Zhang Bing considered the general rules of natural object distribution and utilized the features of massive hyperspectral remote sensing data. They employed an expert decision classification method optimized for spectral features to achieve fine classification of agricultural crops in Minamimaki, Japan, using hyperspectral imagery. The results demonstrated that this classification approach not only improved the accuracy of pixel classification but also significantly reduced misclassification noise in the resulting classification map.
● Hyperspectral Technology’s Application in Fine Crop Classification and Recognition
China is the world's largest grain-producing country, with grains including rice, wheat, corn, peanuts, and more. Through the application of hyperspectral imaging technology, acute detection of rice is conducted to assess its quality and variety. By obtaining hyperspectral images of rice, data in the images are processed using principal component analysis (PCA) to reduce dimensionality and extract characteristics such as whiteness and shape. Grain recognition models for rice are established using PCA and backpropagation neural network (BPNN). It is found that the BPNN model yields satisfactory results, with an accuracy of 89.91%, while PCA achieves an accuracy of 89.18%, with little difference between the two. By combining BPNN with data fusion, the accuracy is further improved to 94.45%. Therefore, the application of hyperspectral imaging technology for grain detection proves to be practical for rice variety and quality analysis.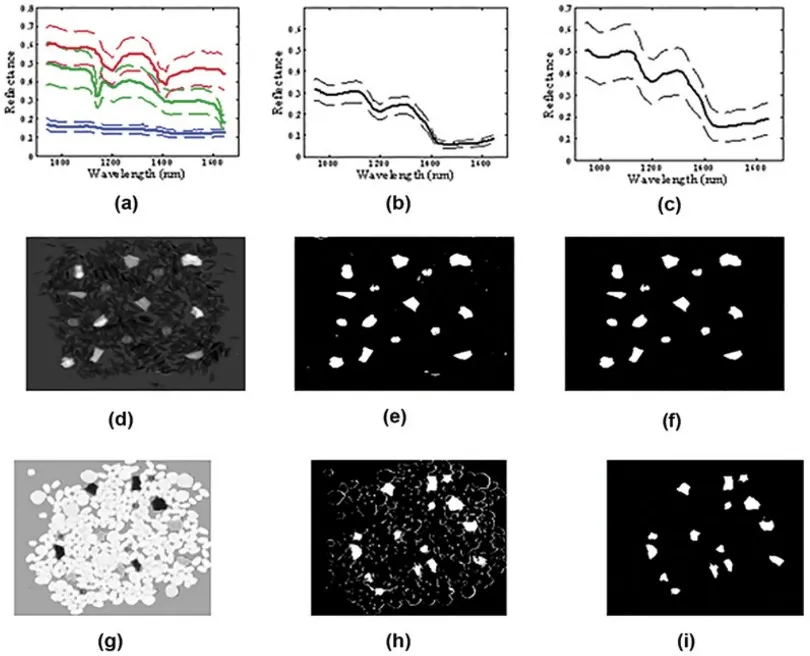
● Hyperspectral Technology’s Application in Photosynthesis Research
The paper titled "Kleptoplast photosynthesis is nutritionally relevant in the sea slug Elysia viridis," published in 2017, investigated the phenomenon of "photosynthesis" in sea slugs. These sea slugs feed on large algae and incorporate the algal chloroplasts into their renal tubule cells. Researchers utilized hyperspectral imaging to study the abundance, distribution, and photosynthetic mechanisms of the chloroplasts within the sea slugs. It was observed that after 24 days of dark starvation, the chloroplasts within the sea slugs significantly decreased in number. This suggests that under extremely adverse conditions, the chloroplasts within the sea slugs can undergo degradation to meet their energy requirements.
● Hyperspectral Technology’s Application in Biomedical
The paper titled "Hyperspectral imaging and spectral-spatial classification for cancer detection," published in 2012, introduces hyperspectral imaging as an emerging technology for biomedical applications. The study proposes an advanced image processing and classification method for analyzing hyperspectral image data in prostate cancer detection. A least squares support vector machine (LS-SVM) is developed and evaluated for classifying hyperspectral data to enhance the detection of cancerous tissue. The method is applied to detect prostate cancer in tumor-bearing mice. Spatially resolved images are created to highlight the differences in reflectance characteristics between cancerous and normal tissues. Preliminary results in mice demonstrate that hyperspectral imaging and classification methods can reliably detect prostate tumors in animal models. Hyperspectral imaging technology provides a new tool for optical diagnosis of cancer.
In separate studies by Houzhu Ding et al. (2015) and Michael S. Chin et al. (2015), pigs and nude mice were used as experimental animals for hyperspectral imaging research on burn classification and recovery. The left image shows the distribution of oxygen saturation and hemoglobin in burn areas obtained through hyperspectral imaging analysis. T00, T01, T04, T24 represent the time points of 0 hours, 1 hour, 4 hours, and 24 hours after the burn, respectively. The right image consists of a color image of burned skin in nude mice, an image of oxygenated hemoglobin obtained through hyperspectral imaging analysis, and a tissue section. Hyperspectral imaging enables non-destructive, non-contact, and high-throughput grading of burn depth.
These studies demonstrate the potential of hyperspectral imaging in biomedical research, particularly in cancer detection and burn assessment, by leveraging the spectral and spatial information provided by this technology. The combination of hyperspectral imaging and advanced analysis methods offers valuable insights into disease diagnosis, monitoring, and treatment evaluation.
● Hyperspectral Technology’s Application in Biological Classification
The paper titled "Non-Invasive Measurement of Frog Skin Reflectivity in High Spatial Resolution Using a Dual Hyperspectral Approach," published in 2013, investigated the spectral reflectance of three species of arboreal frogs using a dual-camera setup composed of two push-broom hyperspectral imaging systems. The systems generated reflectance images between 400 and 2500nm. The researchers analyzed the spectral reflectance of the frogs' skin.
All three species of tree frogs exhibited a visually observable green coloration. However, significant differences in spectral reflectance between the species were observed between 700 and 1100nm, allowing for species differentiation.
In this study, the dual hyperspectral imaging approach provided high spatial resolution and a wide spectral range for analyzing the frog skin reflectivity. The findings highlight the potential of hyperspectral imaging in non-invasively studying the spectral properties of frog skin, particularly in discerning different species based on their distinctive spectral reflectance patterns.
● Hyperspectral Technology’s Application in Archaeology of Cultural Heritage
Since the discovery of the Terracotta Warriors and Horses in 1974, they have garnered worldwide attention and have been hailed as the "Eighth Wonder of the World" by former French President Jacques Chirac. However, these precious cultural relics, including the Terracotta Warriors, have been buried underground for over two thousand years and are suddenly exposed to the air, making them highly susceptible to changes and posing significant challenges in terms of restoration and preservation.
Hyperspectral imaging technology enables the non-contact acquisition of image spectral information from the Terracotta Warriors. By analyzing the images and spectral information of the Terracotta Warriors, one can assess the extent of deterioration caused by diseases and determine the pigments used in their production. Based on the analysis results, simulated restoration can be performed.
The utilization of hyperspectral imaging technology in the restoration and preservation of the Terracotta Warriors provides valuable insights into their condition and assists in developing appropriate restoration strategies. This technology allows for non-invasive examination and documentation of the Terracotta Warriors' surface features, pigments, and deterioration patterns. By understanding the extent of damage and the original coloring materials, experts can make informed decisions regarding the restoration process.
The application of hyperspectral imaging technology not only contributes to the restoration of the Terracotta Warriors but also serves as a significant advancement in the field of cultural heritage preservation. It offers a scientific and efficient approach to studying and conserving cultural relics, ensuring their longevity and the transmission of historical and artistic values to future generations.
● Hyperspectral Technology’s Application in Fine Crop Classification and Recognition
Hyperspectral data can distinguish more subtle spectral differences in crops and detect changes in a narrower spectral range, enabling accurate detailed classification and information extraction of crops. Currently, the most popular and widely applied methods for hyperspectral crop classification include Spectral Angle Mapper (SAM) and Decision Tree-based hierarchical classification.
Based on hyperspectral imagery, Xiong Zhen from the Institute of Remote Sensing and Digital Earth of the Chinese Academy of Sciences monitored the growth stages of rice in Changzhou. A hybrid decision tree method was employed for precise classification of rice varieties using hyperspectral images. The classification achieved an accuracy of 94.9% for distinguishing six rice varieties.
Zhang Bing considered the general rules of natural object distribution and utilized the features of massive hyperspectral remote sensing data. They employed an expert decision classification method optimized for spectral features to achieve fine classification of agricultural crops in Minamimaki, Japan, using hyperspectral imagery. The results demonstrated that this classification approach not only improved the accuracy of pixel classification but also significantly reduced misclassification noise in the resulting classification map.
● Hyperspectral Technology’s Application in Fine Crop Classification and Recognition
China is the world's largest grain-producing country, with grains including rice, wheat, corn, peanuts, and more. Through the application of hyperspectral imaging technology, acute detection of rice is conducted to assess its quality and variety. By obtaining hyperspectral images of rice, data in the images are processed using principal component analysis (PCA) to reduce dimensionality and extract characteristics such as whiteness and shape. Grain recognition models for rice are established using PCA and backpropagation neural network (BPNN). It is found that the BPNN model yields satisfactory results, with an accuracy of 89.91%, while PCA achieves an accuracy of 89.18%, with little difference between the two. By combining BPNN with data fusion, the accuracy is further improved to 94.45%. Therefore, the application of hyperspectral imaging technology for grain detection proves to be practical for rice variety and quality analysis.
● Hyperspectral Technology’s Application in Fine Crop Classification and Recognition
The primary purpose of identifying tree species in forest is to extract thematic information about forest tree species, providing a foundation and basis for forest classification, forest mapping, and forest resource inventory.
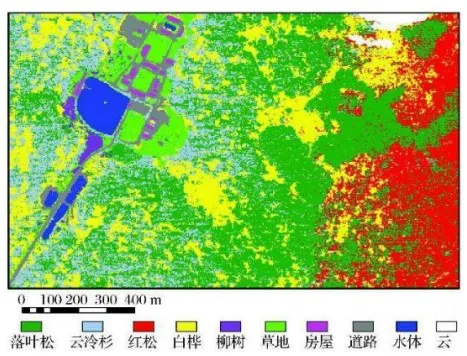
Currently, research in this field has focused mainly on vegetation identification and mapping in wetland habitats such as rivers, lakes, salt marshes, and coastal areas, which involve differentiation at the community level. Typical spectral curves for different species are extracted by combining ground surveys. The data source used is field measurements obtained by hyperspectral imaging instruments. By establishing spectral information models and other methods, the identification of major species, forest types, or specific tree species is achieved. Scholars have used this approach to study vegetation spatial distribution mapping and vegetation change monitoring, and have achieved good consistency with ground data.
Methods such as mixed decision trees and expert decision trees are commonly used for fine classification of crops, while hyperspectral imaging is more extensively applied in areas such as estimation of grassland biomass and extraction of physical and chemical information from crops.
● Hyperspectral Technology’s Application in Fine Crop Classification and Recognition
The primary purpose of identifying tree species in forest is to extract thematic information about forest tree species, providing a foundation and basis for forest classification, forest mapping, and forest resource inventory.
Currently, research in this field has focused mainly on vegetation identification and mapping in wetland habitats such as rivers, lakes, salt marshes, and coastal areas, which involve differentiation at the community level. Typical spectral curves for different species are extracted by combining ground surveys. The data source used is field measurements obtained by hyperspectral imaging instruments. By establishing spectral information models and other methods, the identification of major species, forest types, or specific tree species is achieved. Scholars have used this approach to study vegetation spatial distribution mapping and vegetation change monitoring, and have achieved good consistency with ground data.
Methods such as mixed decision trees and expert decision trees are commonly used for fine classification of crops, while hyperspectral imaging is more extensively applied in areas such as estimation of grassland biomass and extraction of physical and chemical information from crops.
Get Your Free Spectral Analysis Solution.
Tell us about your requirements. Our experts will contact you within 24 hours.
Focus on spectral sensing and optoelectronic application systems