


Get Your Free Spectral Analysis Solution.
Tell us about your requirements. Our experts will contact you within 24 hours.
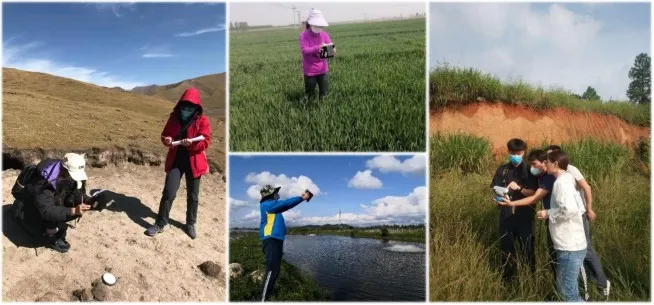
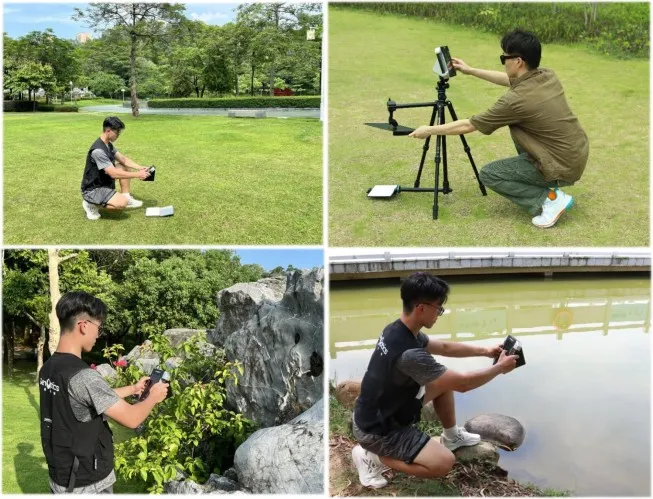
The iSpecField-HH handheld field spectrometer is the latest product from LiSen Optics designed specifically for remote sensing environmental monitoring in the field. It is a truly portable handheld spectral analyzer due to its flexible and convenient operation, fast spectral testing speed, and accurate spectral data. The iSpecField-HH features a 7-inch industrial-grade touch screen display and the unique optical design with a built-in camera, GPS, the laser indicator, a built-in optical shutter control, a remote trigger, and the software that can be set to automatic collection mode (specifying scan times and automatic data saving), making it more convenient for field operations and ideal for complex field environment monitoring and measurement.
The iSpecField-HH handheld field spectrometer is the latest product from LiSen Optics designed specifically for remote sensing environmental monitoring in the field. It is a truly portable handheld spectral analyzer due to its flexible and convenient operation, fast spectral testing speed, and accurate spectral data. The iSpecField-HH features a 7-inch industrial-grade touch screen display and the unique optical design with a built-in camera, GPS, the laser indicator, a built-in optical shutter control, a remote trigger, and the software that can be set to automatic collection mode (specifying scan times and automatic data saving), making it more convenient for field operations and ideal for complex field environment monitoring and measurement.
iSpecField-HH uses a high signal-to-noise ratio, 2048 pixels Probe, with the shortest integration time reaching 50 microseconds. It has a wide dynamic range to avoid saturation of sunlight intensity during outdoor measurements. It also uses the unique optical design, noise calibration technology, and high spectral data resolution. It is widely used in the remote sensing measurements, crop monitoring, forest research, marine research, mineral exploration, and other fields.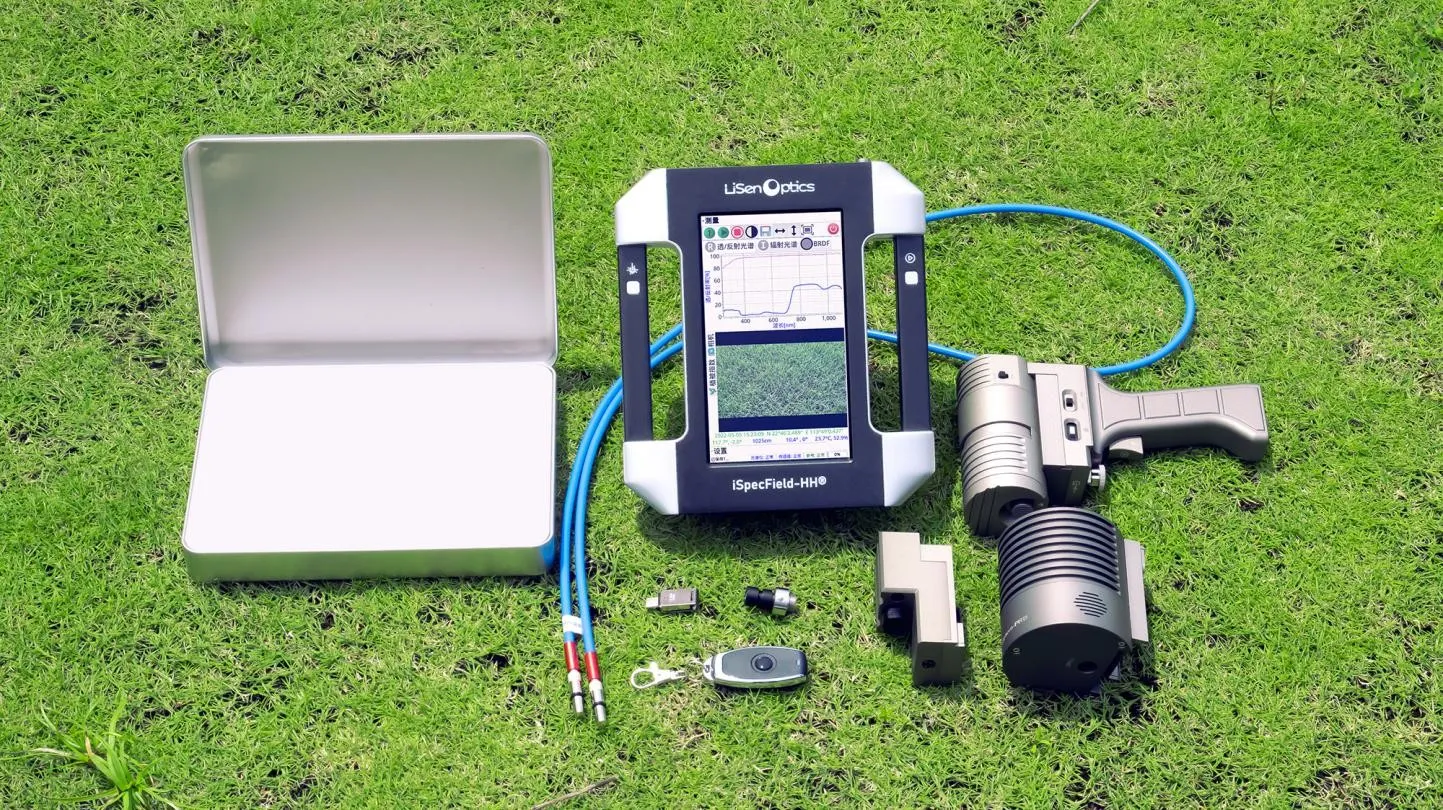
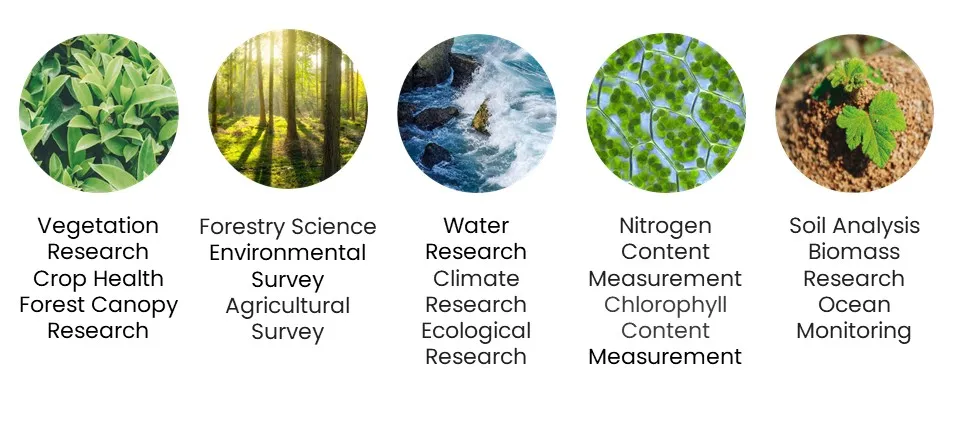
Typical Applications
Technical Advantages
● Spectral range: 200-1100nm
● 2048 pixels
● High spectral precision and resolution
● Minimum integration time of 60 microseconds
● Wide measurement dynamic range
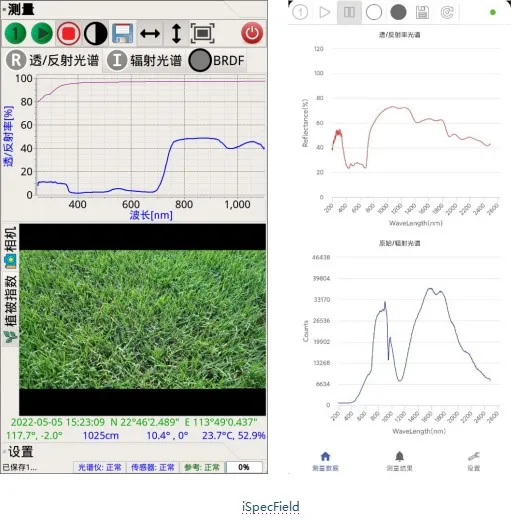
● Equipped with a 7-inch high-definition touch screen display for remote triggering and one-touch measurements
● Unique optical design featuring a built-in autofocus camera (>5 million pixels), GPS, laser indicator, and integrated optical shutter control
● Real-time display of solar azimuth/zenith angle, BRDF testing capability, unmanned aerial vehicle (UAV) onboard survey mode, and support for commonly used vegetation indices such as NDVI, DVI, EVI, CARI, PRI, RDVI, RVI, SAVI, SIPI, TVI, WI, VARI_700, VARI_green, and more
● Multifunctional sensor for synchronized data acquisition, including GPS positioning, ground object imaging, angle measurement, distance measurement, and simultaneous display of air temperature and humidity
● Multi-functional sensor for synchronized data acquisition: simultaneous display of GPS positioning, ground object imaging, angle measurement, distance measurement, and air temperature and humidity measurement.
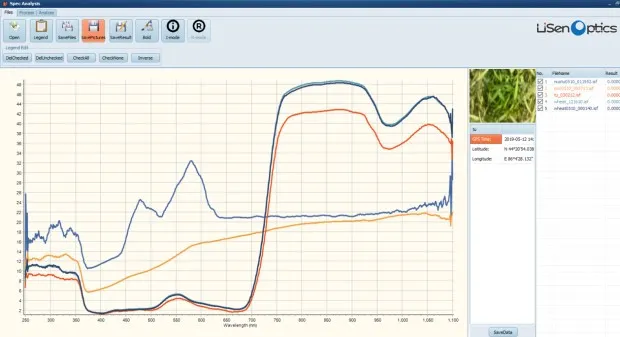
● SpecAnalysis specialized software for dedicated analysis of ground objects, supporting ENVI format and embedded with the USGS database and 13 vegetation indices, including NDVI.
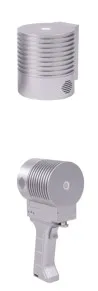
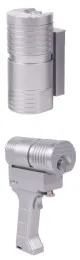
● Wide range of optical accessories for ground obje cts: standard white panel/gray panel, leaf clip, specialized Probes for minerals and soils, pistol-shaped fiber optic probe, indoor sunlight source, field of view lens, transmission and reflectance laboratory support device, remote trigger, and more. These accessories cater to measurement requirements in both field and laboratory settings, allowing for tests on transmission and reflectance, irradiance, radiance, and other parameters.
● Industrial-grade touch screen display, with a total weight not exceeding 1.5 kilograms, ensuring flexible and convenient operation.
Technical Advantages
iSpecField-HH uses a high signal-to-noise ratio, 2048 pixels Probe, with the shortest integration time reaching 50 microseconds. It has a wide dynamic range to avoid saturation of sunlight intensity during outdoor measurements. It also uses the unique optical design, noise calibration technology, and high spectral data resolution. It is widely used in the remote sensing measurements, crop monitoring, forest research, marine research, mineral exploration, and other fields.
Typical Applications
Technical Advantages
● Spectral range: 200-1100nm
● 2048 pixels
● High spectral precision and resolution
● Minimum integration time of 60 microseconds
● Wide measurement dynamic range
● Equipped with a 7-inch high-definition touch screen display for remote triggering and one-touch measurements
● Unique optical design featuring a built-in autofocus camera (>5 million pixels), GPS, laser indicator, and integrated optical shutter control
● Real-time display of solar azimuth/zenith angle, BRDF testing capability, unmanned aerial vehicle (UAV) onboard survey mode, and support for commonly used vegetation indices such as NDVI, DVI, EVI, CARI, PRI, RDVI, RVI, SAVI, SIPI, TVI, WI, VARI_700, VARI_green, and more
● Multifunctional sensor for synchronized data acquisition, including GPS positioning, ground object imaging, angle measurement, distance measurement, and simultaneous display of air temperature and humidity
● Multi-functional sensor for synchronized data acquisition: simultaneous display of GPS positioning, ground object imaging, angle measurement, distance measurement, and air temperature and humidity measurement.
● SpecAnalysis specialized software for dedicated analysis of ground objects, supporting ENVI format and embedded with the USGS database and 13 vegetation indices, including NDVI.
● Wide range of optical accessories for ground obje cts: standard white panel/gray panel, leaf clip, specialized Probes for minerals and soils, pistol-shaped fiber optic probe, indoor sunlight source, field of view lens, transmission and reflectance laboratory support device, remote trigger, and more. These accessories cater to measurement requirements in both field and laboratory settings, allowing for tests on transmission and reflectance, irradiance, radiance, and other parameters.
● Industrial-grade touch screen display, with a total weight not exceeding 1.5 kilograms, ensuring flexible and convenient operation.
Technical Advantages
![]() Main Technical Indicators
Main Technical Indicators
|
Model |
iSpecField-HH -SCE |
iSpecField-HH |
iSpecField-HH-PRO |
|
Wavelength range |
350-1100nm |
300-1100nm |
200-1100nm |
|
Wavelength accuracy |
≤±1nm |
≤±0.5nm |
≤±0.3nm |
|
Wavelength Repeatability |
±0.1nm |
±0.1nm |
±0.1nm |
|
Spectral resolution |
≤3nm@300-1100 nm |
≤1.5nm@300-1100 nm |
≤1nm@200-1100 nm |
|
Spectral wavelength sampling interval |
1nm@300-1100 nm |
0.5nm@300-1100 nm |
0.3nm@200-1100 nm |
|
Number of spectral channels |
750 |
1600 |
3000 |
|
NEdL (Noise Equivalent Radiance) |
8x10⁻⁸W/cm2/nm/sr @ 700 nm |
5x10⁻⁹W/cm2/nm/sr @ 700 nm |
1x10⁻⁹W/cm2/nm/sr @ 700 nm |
|
Probe |
2048 pixels |
2048 pixels |
2048 pixels |
|
FOV |
8°(4°、10°、15°、25°optional FOV Fiber Probe) |
||
|
Exposure time |
1ms-10s |
100μs-20s |
60μs-30s |
|
Touch screen size |
7-inch (1024*600) |
7-inch |
7-inch |
|
Memory capacity |
8GB |
16GB |
64GB |
|
GPS |
YES |
YES |
YES |
|
Solar azimuth/zenith angle |
NO |
YES |
YES |
|
Real-time display of vegetation indices |
YES |
YES |
YES |
|
Remote triggering / airborne survey capability |
Manual Trigger |
YES |
YES |
|
BRDF |
NO |
YES |
YES |
|
Multi-functional synchronized data acquisition |
NO |
Angle, Distance, Temperature, Humidity |
Angle, Distance, Temperature, Humidity |
|
Camera (imager) resolution |
5-Megapixel Autofocus |
8-Megapixel Autofocus |
12-Megapixel stabilization Autofocus |
|
Aiming method |
Infrared laser |
Infrared laser |
Infrared laser |
|
Optical shutter control |
Auto |
Auto |
Auto |
|
Spectral software |
LiSpecView-Field(For PC)、SpecAnalysis(For data Analysis) |
||
|
Battery Endurance |
|
4-5 Hours |
|
|
Dimensions/Weight |
150×100×93mm/1.5KG |
||
Optical Accessories
|
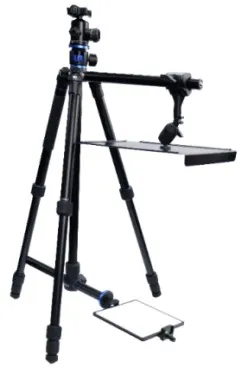
● BRDF Optical Accessories 1. Capable of BRDF measurements. 2. Designed to be used with a tripod and BRDF-150mm standard plate for optimal compatibility. 3. Compatible with the main unit and software, providing real-time display of BRDF bidirectional reflectance factors. |
|
● FOV Lens 1. Spectral range: 350-2500nm 2. Field of view (FOV): 4°, 5°, 8°, 10°, 15° 3. Interface: Dedicated optical interface, compatible for direct coupling with existing handheld spectrometers 4. Dedicated protective box for the field of view lens. 5. Measurement of water body radiance (requires radiance calibration) or measurement of specific areas of interest using the field of view lens. |
|
|
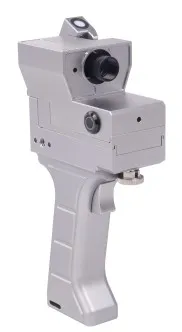
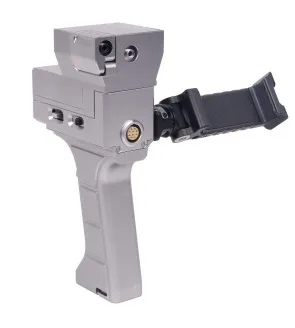
● 25° FOV Pistol-style Handle Fiber Optic Probe 1. Field of view: 25° 2. Optical indicator: Red laser pointer 3. Compatibility with field of view lenses: Supports direct attachment of 4°, 5°, 10°, 15°, and other field of view lenses, interchangeable. 4. Interface flexibility: Directly compatible with high-density mineral Probes, leaf transmission clip with light source. 5. Optical indicator: Red laser pointer. 6. Measurement mode: Contact-trigger control or remote remote-trigger control. 7. Power supply: Touch-based power supply, built-in replaceable lithium battery, no external power source required. |
|
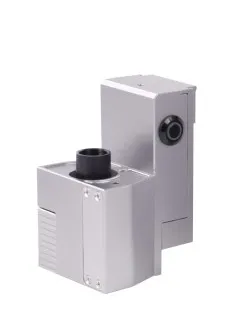
● High-density Reflectance Probe for Minerals, Vegetation, and Soil 1. Optical path configuration: Reflection, high-intensity multi-source d/0 integrating sphere light source. 2. Uniformity: ≥99%. 3. Spectral range: 350-2500nm. 4. Sampling port: 6mm with sapphire window. 5. Optical indicator: Red laser pointer. 6. Measurement mode: Contact-trigger control or remote remote-trigger control. 7. Power supply: Touch-based power supply, built-in replaceable lithium battery, no external power source required. 8. Designed for use with the pistol-style handle fiber optic Probe |
|
|
● Leaf Clip With Built-in Light Source 1. Optical path configuration: Transmission, with a built-in 5W high-intensity light source. 2. Light source spectral range: 350-2500nm. 3. Optical indicator: Red laser pointer. 4. Mounting method: Magnetic, with a quartz output window. 5. Power supply: Touch-based power supply, built-in replaceable lithium battery, no external power source required. 6. Designed for use with the pistol-style handle fiber optic Probe. |
|
● Laboratory Transmittance and Reflection Fixture 1. Integration sphere inner diameter: 100mm 2. Aperture: 3 apertures, 1 inch 3. Function: Transmittance and Reflection 4. Spectral range: 250-2500nm 5. Configuration: Optional components for transmittance and reflectance measurement include transmittance lens, the leaf clip, spectral interface, integrated spectrometer, light source, and Trans./Ref fixture platform. |
|
|
● Weatherproof Cosine Probe 1. Spectral range: 200-2500nm 2. Uniformity: 99% 3. Diameter: 8mm 4. Interface: Dedicated optical interface, compatible for direct coupling with existing handheld spectrometers 5. Measurement of solar irradiance functionality, requires radiance calibration for accurate readings. |
|
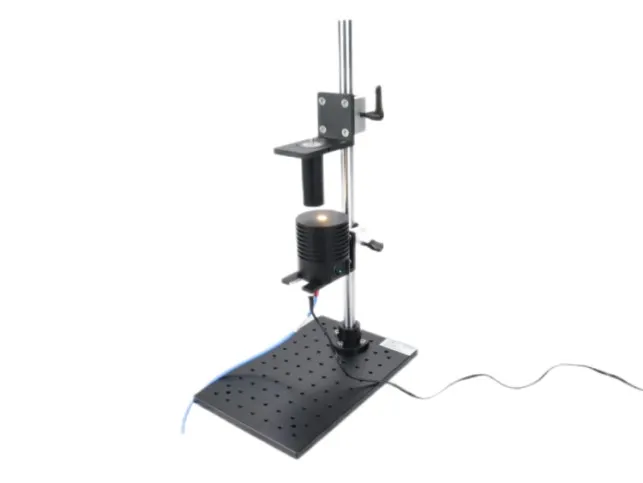
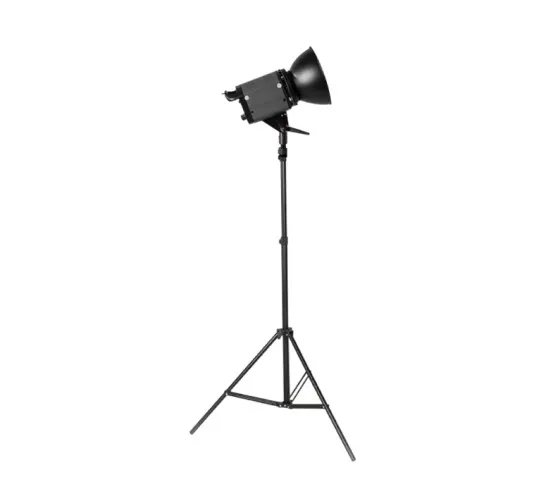
● Indoor Solar Simulation Light Source 1. Light source output power: 1000W 2. Spectral range: 350-2500nm 3. Color temperature: 3000K±200K 4. Light intensity adjustment: Dimmable 5. Mounting method: Mobile and detachable tripod 6. Power supply: 220V/AC |
|
|
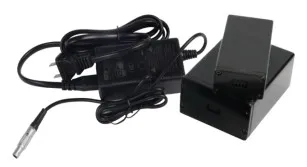
● Interchangeable Spare Battery For Handheld Spectrometer 1. Battery capacity: 9000mAh 2. Voltage: 11.1V 3. Operation time: 4-5 hours 4. Charging method: Dock charging with included charger |
|
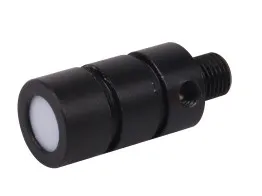
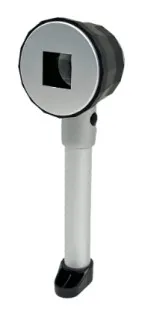
● Optical Fiber Inspection Prob 1. Observation window with magnifying lens 2. Built-in LED light source 3. Battery-powered 4. Stainless steel handle |
|
|
● 25°FOV Pistol-style Handle Fiber Optic Probe Mobile Phone Fixture The Fixture for 5.1 inch Android tablet. |
|
● Remote Trigger 1. Trigger-based remote control button. 2. Compatible for use with the mainframe, pistol-style handle fiber optic Probe, and high-density reflectance Probe. |
|
|
● Portable Computer Bag Belt for Outdoors Portable computer bag belt designed for 14 inch laptop, use for the fixture in order to meet the need of single one use. |
|
● 14 inch Lenovo’s Laptop Optional to choose |
|
|
● Portable Outdoor Instrument Box Size:61cm(Length)×46cm(Width)×31cm(Height) |
|
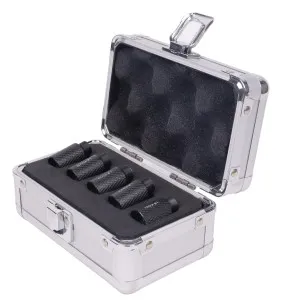
● Portable Outdoor Optical Accessories Box For probe, Leaf Clip and FOV Lens. Size:36cm(Length)×26.5cm(Width)×17cm(Height) |
|
|
● 5-meter Full-band 25-degree Field of View Optical Fiber Probe 5-meter Full-band 25-degree Field of View Optical Fiber Probe: Longer fiber lengths are required for water measurements conducted from a ship. |
|
||
|
● Reference Panels(white and gray reference panels) 1. Spectral range: 250-2500nm 2. Uniformity: Better than 0.1% 3. Reflectance:3%/5%/10%/20%/30%/40%/50%/≥98% (with factory-traceable reflectance data test report) 4. Dimensions:185×165mm/250×250mm. 5. Professional portable carrying case, PET dust protection, and dust removal kit. |
|
||
Optical Accessories
|
● BRDF Optical Accessories 1. Capable of BRDF measurements. 2. Designed to be used with a tripod and BRDF-150mm standard plate for optimal compatibility. 3. Compatible with the main unit and software, providing real-time display of BRDF bidirectional reflectance factors. |
|
● FOV Lens 1. Spectral range: 350-2500nm 2. Field of view (FOV): 4°, 5°, 8°, 10°, 15° 3. Interface: Dedicated optical interface, compatible for direct coupling with existing handheld spectrometers 4. Dedicated protective box for the field of view lens. 5. Measurement of water body radiance (requires radiance calibration) or measurement of specific areas of interest using the field of view lens. |
|
|
● 25° FOV Pistol-style Handle Fiber Optic Probe 1. Field of view: 25° 2. Optical indicator: Red laser pointer 3. Compatibility with field of view lenses: Supports direct attachment of 4°, 5°, 10°, 15°, and other field of view lenses, interchangeable. 4. Interface flexibility: Directly compatible with high-density mineral Probes, leaf transmission clip with light source. 5. Optical indicator: Red laser pointer. 6. Measurement mode: Contact-trigger control or remote remote-trigger control. 7. Power supply: Touch-based power supply, built-in replaceable lithium battery, no external power source required. |
|
● High-density Reflectance Probe for Minerals, Vegetation, and Soil 1. Optical path configuration: Reflection, high-intensity multi-source d/0 integrating sphere light source. 2. Uniformity: ≥99%. 3. Spectral range: 350-2500nm. 4. Sampling port: 6mm with sapphire window. 5. Optical indicator: Red laser pointer. 6. Measurement mode: Contact-trigger control or remote remote-trigger control. 7. Power supply: Touch-based power supply, built-in replaceable lithium battery, no external power source required. 8. Designed for use with the pistol-style handle fiber optic Probe |
|
|
● Leaf Clip With Built-in Light Source 1. Optical path configuration: Transmission, with a built-in 5W high-intensity light source. 2. Light source spectral range: 350-2500nm. 3. Optical indicator: Red laser pointer. 4. Mounting method: Magnetic, with a quartz output window. 5. Power supply: Touch-based power supply, built-in replaceable lithium battery, no external power source required. 6. Designed for use with the pistol-style handle fiber optic Probe. |
|
● Laboratory Transmittance and Reflection Fixture 1. Integration sphere inner diameter: 100mm 2. Aperture: 3 apertures, 1 inch 3. Function: Transmittance and Reflection 4. Spectral range: 250-2500nm 5. Configuration: Optional components for transmittance and reflectance measurement include transmittance lens, the leaf clip, spectral interface, integrated spectrometer, light source, and Trans./Ref fixture platform. |
|
|
● Weatherproof Cosine Probe 1. Spectral range: 200-2500nm 2. Uniformity: 99% 3. Diameter: 8mm 4. Interface: Dedicated optical interface, compatible for direct coupling with existing handheld spectrometers 5. Measurement of solar irradiance functionality, requires radiance calibration for accurate readings. |
|
● Indoor Solar Simulation Light Source 1. Light source output power: 1000W 2. Spectral range: 350-2500nm 3. Color temperature: 3000K±200K 4. Light intensity adjustment: Dimmable 5. Mounting method: Mobile and detachable tripod 6. Power supply: 220V/AC |
|
|
● Interchangeable Spare Battery For Handheld Spectrometer 1. Battery capacity: 9000mAh 2. Voltage: 11.1V 3. Operation time: 4-5 hours 4. Charging method: Dock charging with included charger |
|
● Optical Fiber Inspection Prob 1. Observation window with magnifying lens 2. Built-in LED light source 3. Battery-powered 4. Stainless steel handle |
|
|
● 25°FOV Pistol-style Handle Fiber Optic Probe Mobile Phone Fixture The Fixture for 5.1 inch Android tablet. |
|
● Remote Trigger 1. Trigger-based remote control button. 2. Compatible for use with the mainframe, pistol-style handle fiber optic Probe, and high-density reflectance Probe. |
|
|
● Portable Computer Bag Belt for Outdoors Portable computer bag belt designed for 14 inch laptop, use for the fixture in order to meet the need of single one use. |
|
● 14 inch Lenovo’s Laptop Optional to choose |
|
|
● Portable Outdoor Instrument Box Size:61cm(Length)×46cm(Width)×31cm(Height) |
|
● Portable Outdoor Optical Accessories Box For probe, Leaf Clip and FOV Lens. Size:36cm(Length)×26.5cm(Width)×17cm(Height) |
|
|
● 5-meter Full-band 25-degree Field of View Optical Fiber Probe 5-meter Full-band 25-degree Field of View Optical Fiber Probe: Longer fiber lengths are required for water measurements conducted from a ship. |
|
||
|
● Reference Panels(white and gray reference panels) 1. Spectral range: 250-2500nm 2. Uniformity: Better than 0.1% 3. Reflectance:3%/5%/10%/20%/30%/40%/50%/≥98% (with factory-traceable reflectance data test report) 4. Dimensions:185×165mm/250×250mm. 5. Professional portable carrying case, PET dust protection, and dust removal kit. |
|
||
Application in Agriculture and Forestry
Vegetation serves as a significant domain of application in the field of optoelectronics, particularly in remote sensing. The utilization of remote sensing in the vegetation analysis primarily revolves around the determination of vegetation distribution, classification, and growth patterns. Different plant species exhibit distinctive spectral signatures due to variations in their structural composition and chlorophyll content, with notable discrepancies observed in the near-infrared spectral range. Spectral imaging techniques can effectively discern between various types of vegetation, such as deciduous and evergreen trees, by capitalizing on the phenological differences during different seasons. Additionally, alterations in the vegetation structure and chlorophyll content resulting from factors like diseases and pest infestations manifest prominently in the near-infrared range, presenting discernible deviations from healthy vegetation. Prominent factors influencing the spectral characteristics of vegetation encompass the botanical taxonomy, seasonal dynamics, and the influences exerted by pests and diseases. n
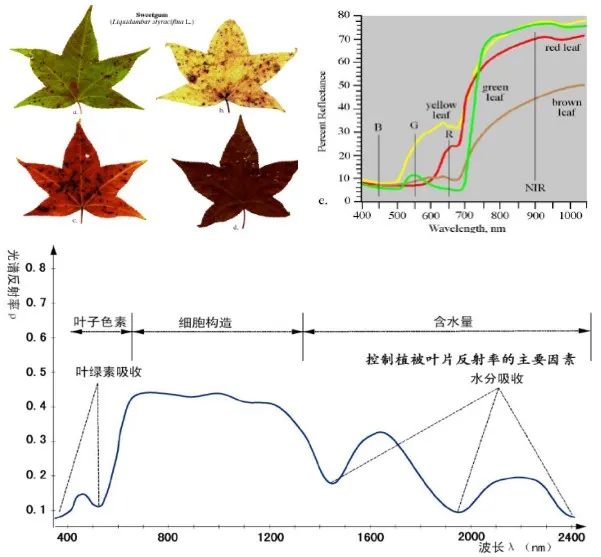 The key spectral features of vegetation can be summarized as follows in the field of optoelectronics: In the visible light range of 0.4 to 0.76 μm, a distinct reflection peak is observed, typically with reflectance ranging from 10% to 20%, centered around 0.55 μm (green). Additionally, there are two absorption bands flanking this peak at approximately 0.45 μm (blue) and 0.67 μm (red). Moving into the near-infrared range of 0.7 to 0.8 μm, a significant increase in reflectance occurs, characterized by a steep slope. Near 1.1 μm, another notable peak is observed, representing a unique spectral feature specific to vegetation. Transitioning to the mid-infrared range of 1.3 to 2.5 μm, the presence of water content in plants becomes a prominent factor. As a result, there is a substantial increase in absorption and a corresponding decrease in reflectance. Three distinct absorption valleys are evident near 1.4 μm, 1.9 μm, and 2.6 to 2.7 μm, primarily governed by the absorption properties of water within the cellular structure of leaves. The influencing factors in this absorption phenomenon encompass leaf thickness and water content.
Application in Ecological Environment
Soil remote sensing, within the field of optoelectronics, focuses on utilizing the spectral characteristics of soil to identify and classify different soil types, analyze the spatial distribution patterns of soil, and provide a scientific foundation for the rational development, utilization, management, and conservation of soil resources. By preventing the soil quality degradation and quantity reduction, it aims at improving soil conditions and facilitate the sustainable utilization of soil resources, fostering advancements in soil remote sensing science.
Under natural conditions, the reflectance spectrum of the soil surface exhibits a relatively smooth profile without prominent peaks or valleys. Generally, soils with finer particles tend to have higher reflectance values. The reflectance of soil is influenced by factors such as the organic matter content, moisture content, soil composition, and fertility. However, due to the smooth spectral curve, the differentiation of soil brightness on remote sensing images across various spectral bands may not be readily apparent.
Multiple factors contribute to variations in the spectral characteristics of soil, including the primary minerals, secondary minerals, soil moisture content, organic matter content, soil texture, and particle size. The main spectral features of soil are as follows: In its natural state, the reflectance curve of the soil surface lacks distinct peaks and absorption valleys, appearing relatively smooth. Under dry conditions, the spectral properties of soil primarily relate to the presence of primary minerals, secondary minerals, and organic matter.
As the soil moisture content increases, the reflectance of soil decreases, particularly in the vicinity of water absorption bands (around 1.4 μm, 1.9 μm, and 2.7 μm), where the decrease is particularly pronounced. Soil minerals, including quartz, mica, feldspar, oxides, among others, contribute to the differentiation of soil characteristics through the analysis of corresponding mineral contents. Additionally, the size and proportion of soil particles serves as indicators of particle size and water retention capacity.
Application in Mineral Exploration
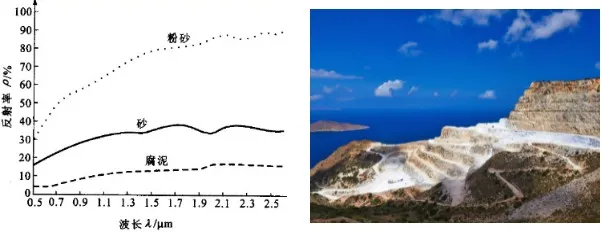
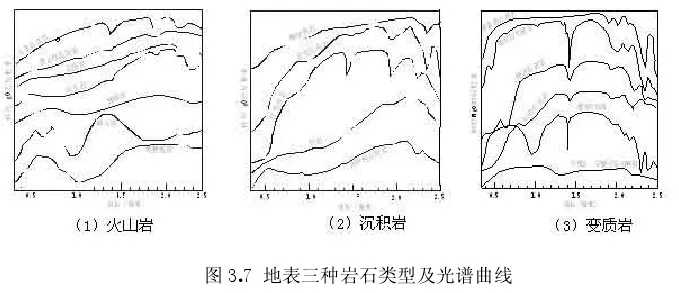
Surface rocks are generally classified into three major categories: sedimentary rocks, volcanic rocks, and metamorphic rocks. The reflectance spectra of several rocks are shown in the figure below. The spectral nature of surface rock is essentially a mixed spectrum of minerals, and its spectral characteristics are influenced by factors such as the composition, structure, texture, and surface condition. Therefore, the identification of minerals through the reflectance spectra of surface minerals can achieve the goal of determining the type of rock.
The reflectance spectrum of rocks is primarily determined by the mineral composition, content, and material structure. Prominent absorption peaks are commonly observed in surface rocks, including hydroxyl-bearing minerals (2.10-2.40 μm), crystalline water minerals (1.40 μm, 2.40 μm), carbonate minerals (1.90 μm, 2.35 μm, 2.5 μm), and iron minerals (0.5 μm, 1.1 μm), among others. For example, the spectral characteristics of rocks in the 3-5 μm wavelength range are determined by the vibrational modes of molecular bonds such as oxygen-silicon and oxygen-aluminum. In addition to material composition, environmental conditions, surface characteristics of rocks and minerals, and physical weathering can also cause variations in the reflectance spectra of rocks, such as changes in reflectance values, positions, widths, absorption depths, and shapes of spectral bands.
Spectral instruments used for remote sensing require low energy and provide rapid analysis within a few seconds. They do not require any chemical reagents and pose no harm to human health. By acquiring spectral reflectance data, they can be utilized for the study of gemstone materials. The high spectral resolution can accurately reveal the information of harmonic and combination frequencies of molecular vibrations in gemstones, allowing for the analysis of complex structural information related to chemical bond interactions. Therefore, the high spectral resolution has significant potential in the gemstone analysis.
 Application in Aquatic Environmental Oceanography
Ocean remote sensing has a broad coverage area and offers the advantages of simultaneity, allowing for continuous, long-term, and rapid observations of the ocean. It provides a comprehensive depiction of oceanic features, including sea surface temperature, oceanic currents, water distribution, waves, coastal sediment plumes, as well as phenomena such as red tides and oil spills. Ocean remote sensing is primarily applied in the investigation and monitoring of large-scale ocean circulation, nearshore surface flow fields, harbor water quality, marine surface chlorophyll concentration, and other aspects related to oceanography, meteorology, biology, physics, marine dynamics, marine pollution, and nearshore engineering.
Ocean remote sensing can be classified into three modalities: space-based remote sensing, airborne remote sensing, and ground-based remote sensing. Remote sensing methods can be divided into two types: active remote sensing, where electromagnetic waves are emitted from sensors to the ocean surface and the returning signals are used to extract oceanic information or images; and passive remote sensing, where sensors only receive the thermal radiation or scattered solar and sky radiance from the ocean surface to retrieve oceanic information or images.
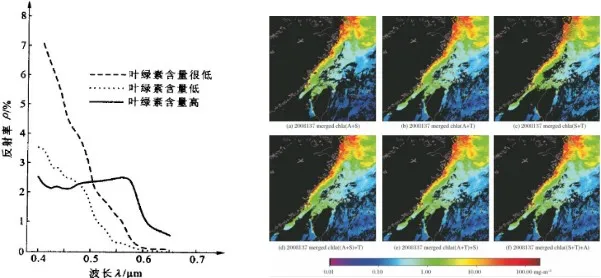
Chlorophyll-a and total suspended matter are two important substances that influence the color of seawater and reflect changes in ocean water quality, making them crucial indicators for marine environmental monitoring. The reflectance of water is generally low, usually less than 10%, much lower than most other terrestrial objects. Water exhibits strong reflectance in the blue-green spectrum, while it absorbs strongly in other visible light spectra. The reflectance spectrum of pure water shows a peak in the blue region, which decreases gradually with increasing wavelength. In the near-infrared region, the reflectance of water is close to zero. However, in the presence of chlorophyll, the reflectance spectrum of clear water exhibits a peak in the green spectrum, and the height of the peak increases with the concentration of chlorophyll. This characteristic can be used to monitor and estimate algal biomass. Conversely, turbid water and sediment-laden water have higher reflectance than pure water, with reflectance peaks appearing in the yellow-red region.
Application in Agriculture and Forestry
Vegetation serves as a significant domain of application in the field of optoelectronics, particularly in remote sensing. The utilization of remote sensing in the vegetation analysis primarily revolves around the determination of vegetation distribution, classification, and growth patterns. Different plant species exhibit distinctive spectral signatures due to variations in their structural composition and chlorophyll content, with notable discrepancies observed in the near-infrared spectral range. Spectral imaging techniques can effectively discern between various types of vegetation, such as deciduous and evergreen trees, by capitalizing on the phenological differences during different seasons. Additionally, alterations in the vegetation structure and chlorophyll content resulting from factors like diseases and pest infestations manifest prominently in the near-infrared range, presenting discernible deviations from healthy vegetation. Prominent factors influencing the spectral characteristics of vegetation encompass the botanical taxonomy, seasonal dynamics, and the influences exerted by pests and diseases. n
The key spectral features of vegetation can be summarized as follows in the field of optoelectronics: In the visible light range of 0.4 to 0.76 μm, a distinct reflection peak is observed, typically with reflectance ranging from 10% to 20%, centered around 0.55 μm (green). Additionally, there are two absorption bands flanking this peak at approximately 0.45 μm (blue) and 0.67 μm (red). Moving into the near-infrared range of 0.7 to 0.8 μm, a significant increase in reflectance occurs, characterized by a steep slope. Near 1.1 μm, another notable peak is observed, representing a unique spectral feature specific to vegetation. Transitioning to the mid-infrared range of 1.3 to 2.5 μm, the presence of water content in plants becomes a prominent factor. As a result, there is a substantial increase in absorption and a corresponding decrease in reflectance. Three distinct absorption valleys are evident near 1.4 μm, 1.9 μm, and 2.6 to 2.7 μm, primarily governed by the absorption properties of water within the cellular structure of leaves. The influencing factors in this absorption phenomenon encompass leaf thickness and water content.
Application in Ecological Environment
Soil remote sensing, within the field of optoelectronics, focuses on utilizing the spectral characteristics of soil to identify and classify different soil types, analyze the spatial distribution patterns of soil, and provide a scientific foundation for the rational development, utilization, management, and conservation of soil resources. By preventing the soil quality degradation and quantity reduction, it aims at improving soil conditions and facilitate the sustainable utilization of soil resources, fostering advancements in soil remote sensing science.
Under natural conditions, the reflectance spectrum of the soil surface exhibits a relatively smooth profile without prominent peaks or valleys. Generally, soils with finer particles tend to have higher reflectance values. The reflectance of soil is influenced by factors such as the organic matter content, moisture content, soil composition, and fertility. However, due to the smooth spectral curve, the differentiation of soil brightness on remote sensing images across various spectral bands may not be readily apparent.
Multiple factors contribute to variations in the spectral characteristics of soil, including the primary minerals, secondary minerals, soil moisture content, organic matter content, soil texture, and particle size. The main spectral features of soil are as follows: In its natural state, the reflectance curve of the soil surface lacks distinct peaks and absorption valleys, appearing relatively smooth. Under dry conditions, the spectral properties of soil primarily relate to the presence of primary minerals, secondary minerals, and organic matter.
As the soil moisture content increases, the reflectance of soil decreases, particularly in the vicinity of water absorption bands (around 1.4 μm, 1.9 μm, and 2.7 μm), where the decrease is particularly pronounced. Soil minerals, including quartz, mica, feldspar, oxides, among others, contribute to the differentiation of soil characteristics through the analysis of corresponding mineral contents. Additionally, the size and proportion of soil particles serves as indicators of particle size and water retention capacity.
Application in Mineral Exploration
Surface rocks are generally classified into three major categories: sedimentary rocks, volcanic rocks, and metamorphic rocks. The reflectance spectra of several rocks are shown in the figure below. The spectral nature of surface rock is essentially a mixed spectrum of minerals, and its spectral characteristics are influenced by factors such as the composition, structure, texture, and surface condition. Therefore, the identification of minerals through the reflectance spectra of surface minerals can achieve the goal of determining the type of rock.
The reflectance spectrum of rocks is primarily determined by the mineral composition, content, and material structure. Prominent absorption peaks are commonly observed in surface rocks, including hydroxyl-bearing minerals (2.10-2.40 μm), crystalline water minerals (1.40 μm, 2.40 μm), carbonate minerals (1.90 μm, 2.35 μm, 2.5 μm), and iron minerals (0.5 μm, 1.1 μm), among others. For example, the spectral characteristics of rocks in the 3-5 μm wavelength range are determined by the vibrational modes of molecular bonds such as oxygen-silicon and oxygen-aluminum. In addition to material composition, environmental conditions, surface characteristics of rocks and minerals, and physical weathering can also cause variations in the reflectance spectra of rocks, such as changes in reflectance values, positions, widths, absorption depths, and shapes of spectral bands.
Spectral instruments used for remote sensing require low energy and provide rapid analysis within a few seconds. They do not require any chemical reagents and pose no harm to human health. By acquiring spectral reflectance data, they can be utilized for the study of gemstone materials. The high spectral resolution can accurately reveal the information of harmonic and combination frequencies of molecular vibrations in gemstones, allowing for the analysis of complex structural information related to chemical bond interactions. Therefore, the high spectral resolution has significant potential in the gemstone analysis.
Application in Aquatic Environmental Oceanography
Ocean remote sensing has a broad coverage area and offers the advantages of simultaneity, allowing for continuous, long-term, and rapid observations of the ocean. It provides a comprehensive depiction of oceanic features, including sea surface temperature, oceanic currents, water distribution, waves, coastal sediment plumes, as well as phenomena such as red tides and oil spills. Ocean remote sensing is primarily applied in the investigation and monitoring of large-scale ocean circulation, nearshore surface flow fields, harbor water quality, marine surface chlorophyll concentration, and other aspects related to oceanography, meteorology, biology, physics, marine dynamics, marine pollution, and nearshore engineering.
Ocean remote sensing can be classified into three modalities: space-based remote sensing, airborne remote sensing, and ground-based remote sensing. Remote sensing methods can be divided into two types: active remote sensing, where electromagnetic waves are emitted from sensors to the ocean surface and the returning signals are used to extract oceanic information or images; and passive remote sensing, where sensors only receive the thermal radiation or scattered solar and sky radiance from the ocean surface to retrieve oceanic information or images.
Chlorophyll-a and total suspended matter are two important substances that influence the color of seawater and reflect changes in ocean water quality, making them crucial indicators for marine environmental monitoring. The reflectance of water is generally low, usually less than 10%, much lower than most other terrestrial objects. Water exhibits strong reflectance in the blue-green spectrum, while it absorbs strongly in other visible light spectra. The reflectance spectrum of pure water shows a peak in the blue region, which decreases gradually with increasing wavelength. In the near-infrared region, the reflectance of water is close to zero. However, in the presence of chlorophyll, the reflectance spectrum of clear water exhibits a peak in the green spectrum, and the height of the peak increases with the concentration of chlorophyll. This characteristic can be used to monitor and estimate algal biomass. Conversely, turbid water and sediment-laden water have higher reflectance than pure water, with reflectance peaks appearing in the yellow-red region.
Get Your Free Spectral Analysis Solution.
Tell us about your requirements. Our experts will contact you within 24 hours.
Focus on spectral sensing and optoelectronic application systems