Get Your Free Spectral Analysis Solution.
Tell us about your requirements. Our experts will contact you within 24 hours.
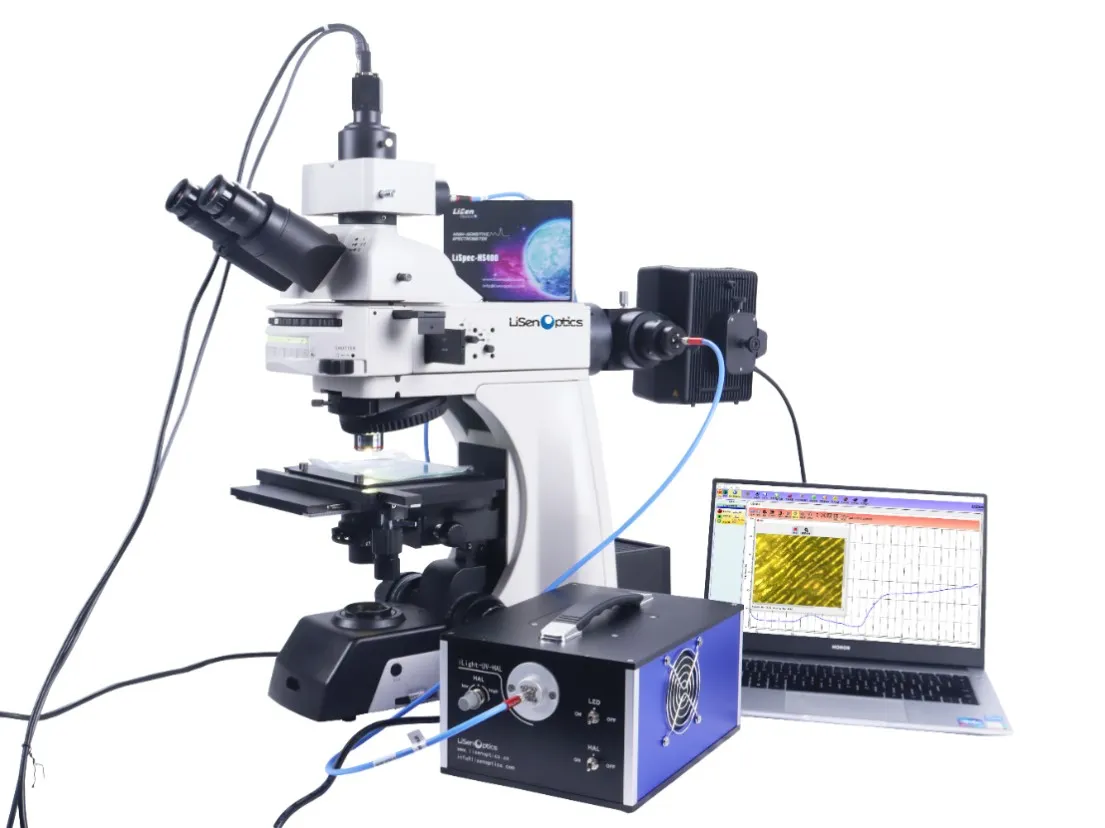
The iSpec-MS series is a Micro-spectroscopy imaging measurement system from LiSen Optics that combines spatial imaging and spectral analysis capabilities. It is capable of testing microscale samples for absorption, reflection, Raman, fluorescence excitation, or as an integrated precision Micro-Spectroscopy system. The system primarily consists of a research-grade metallographic microscope, a high-sensitivity spectrometer, excitation light sources, and spectral analysis software. It can also be equipped with manual/rotating/programmable electronic control displacement stages, with the programmable electronic control displacement stage enabling Micro-Spectroscopy Mapping functionality.
The iSpec-MS series is a Micro-spectroscopy imaging measurement system from LiSen Optics that combines spatial imaging and spectral analysis capabilities. It is capable of testing microscale samples for absorption, reflection, Raman, fluorescence excitation, or as an integrated precision Micro-Spectroscopy system. The system primarily consists of a research-grade metallographic microscope, a high-sensitivity spectrometer, excitation light sources, and spectral analysis software. It can also be equipped with manual/rotating/programmable electronic control displacement stages, with the programmable electronic control displacement stage enabling Micro-Spectroscopy Mapping functionality.
The iSpec-MS Micro-Spectroscopy imaging measurement system can be widely applied in fields such as nanomedicine delivery, nanotoxicology, nanomaterials, cell biology, pathology, virology, botany, and more.
 |
 |
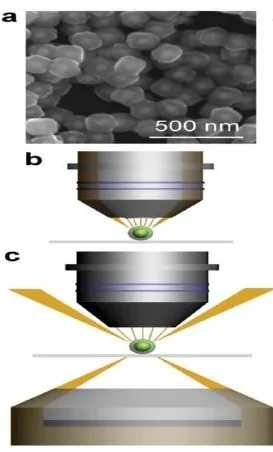
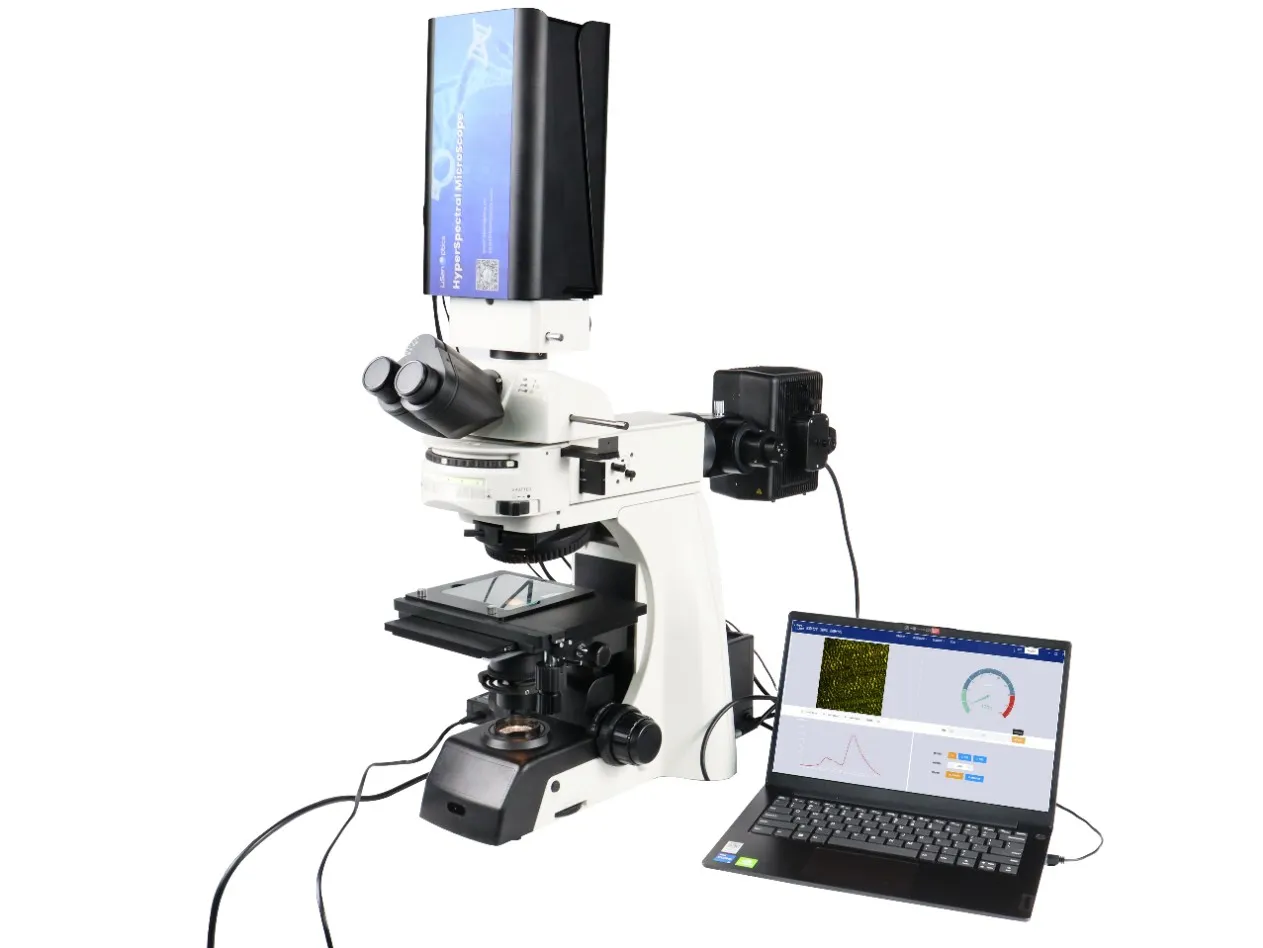
Additionally, the iSpec-MS series Micro-Spectroscopy imaging system can be paired with a built-in push-broom hyperspectral camera independently developed by LiSen Optics. This utilizes spatial imaging full-spectrum seamless scanning technology to achieve hyperspectral collection of microscopic field samples, obtaining fine spatial images of the samples while also acquiring hyperspectral information. The iSpec-MS series can also be customized according to user needs with different spectral ranges, primarily 400-1000nm and 900-1700nm. The hyperspectral camera can choose CMOS/sCMOS/InGaAs detectors to meet different sensitivity and signal-to-noise ratio research needs.
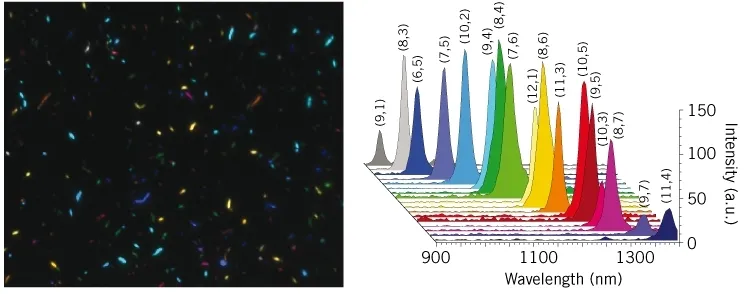
False color patterns of carbon nanotubes on transparent glass show 17 different wavelengths
The microscope light source is richly configured, offering reflective/transmissive halogen light sources, ultraviolet light sources, and LED/LD fluorescence excitation light sources. This powerful and flexible system can be combined with Raman lasers and Raman spectrometers for micro Raman measurements. The spectrometer can use both cooled and uncooled research-grade spectrometers, covering spectral ranges of 200-1100nm/200-1700nm/200-2500nm. High sensitivity research-grade spectrometers use two-stage Peltier TE cooling technology, ensuring long-term stable operation and low noise levels. The optical interface of the research-grade metallographic microscope adopts a universal C-Mount interface adapter.
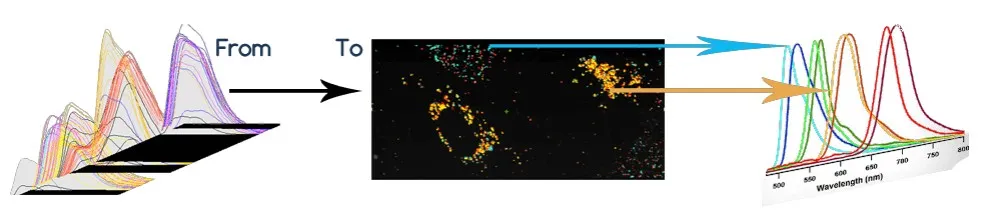
Hyperspectral microscopy displays nanoparticles in cells
LiSpecView, a multifunctional spectral acquisition software, can realize transmission, reflection, fluorescence, color, and other spectral information. It is an integrated software for spectral analysis, light source, displacement stage, color camera image analysis, and instrument control.
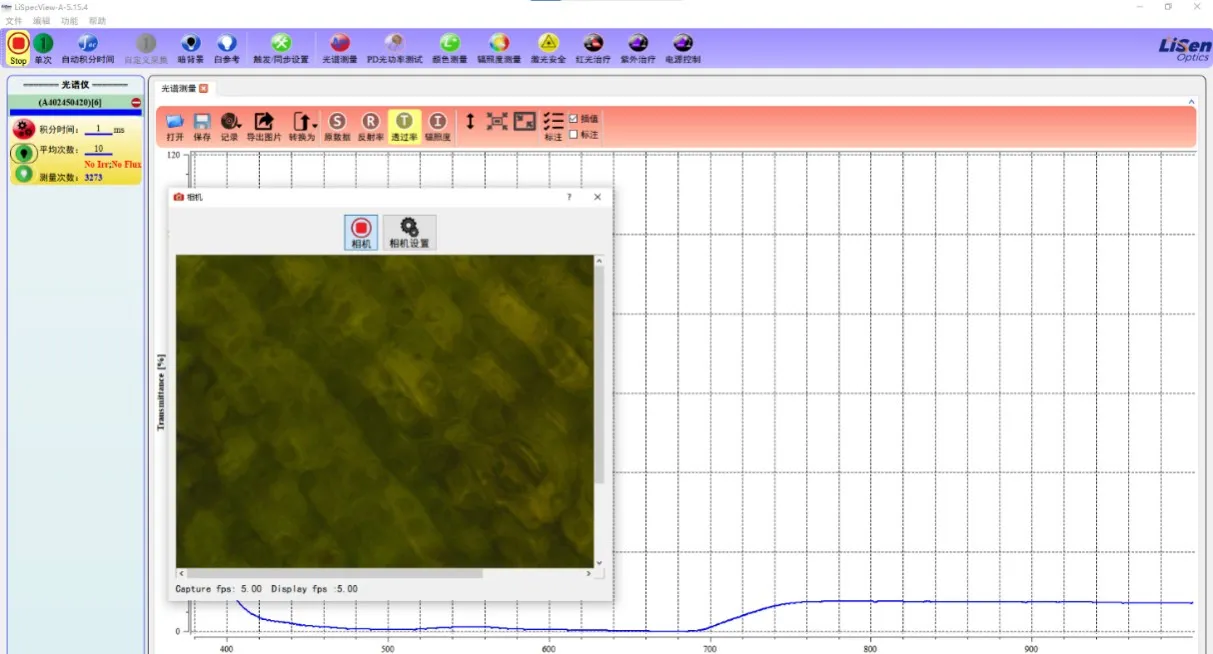
Software’s interface during Sample Measurement
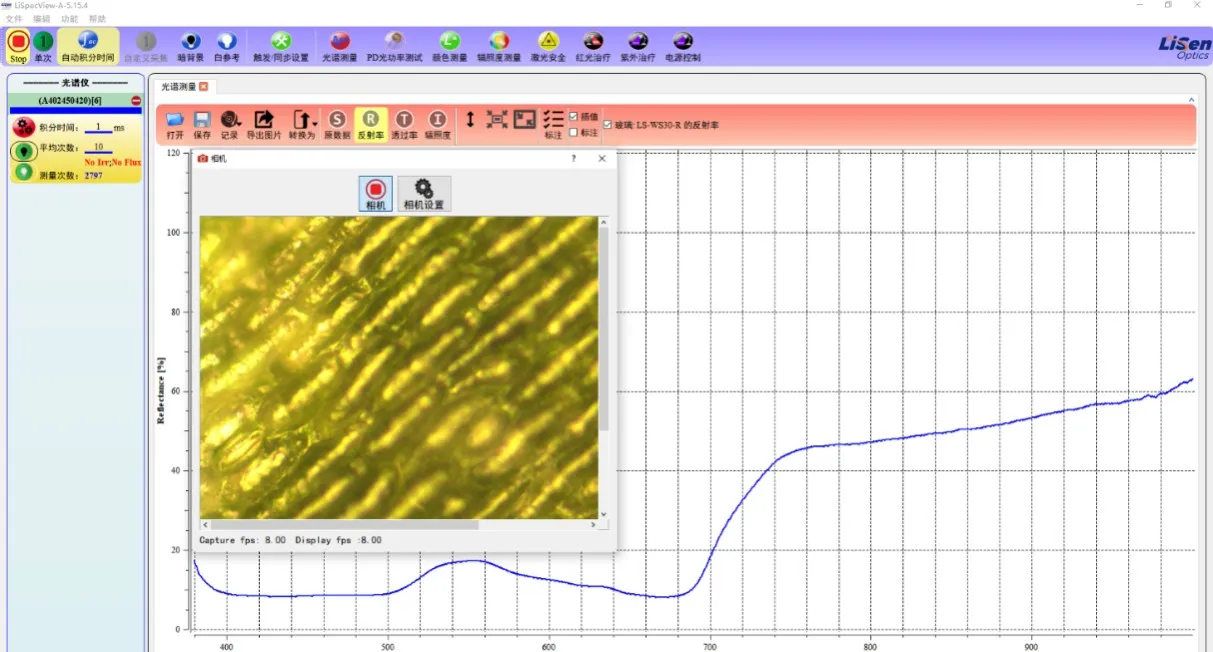
Software’s interface during Sample Measurement
Typical Application
In a production environment, Micro-Spectroscopyimaging measurement systems can be used for quality control of everything from color masks in flat-panel displays to film thickness on semiconductor integrated circuits. Additionally, they are utilized for identifying and quantifying micro-scale samples, including applications in microfluidics, matching fibers or paints for forensic chemists, identifying gems or coal for geologists, measuring ink or paint colors for process chemists, and even analyzing great artworks for preservationists. In cell biology, these systems quantify nanomaterials in cells and tissues, providing both spectral analysis and image data of materials and biological samples.
 |
 |
|
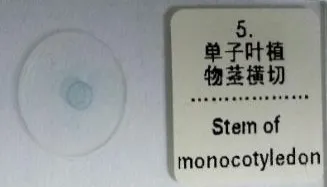
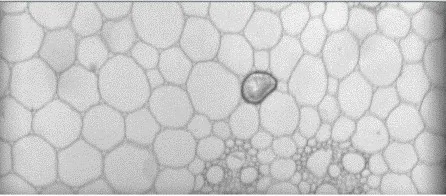
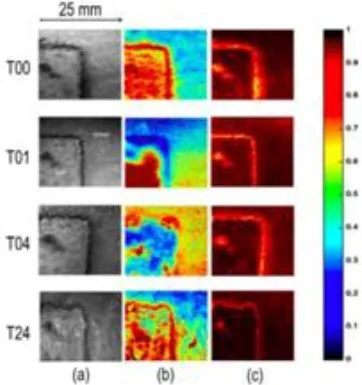
Cross-section of a monocot stem Microphotography |
0-level magnification |
 |
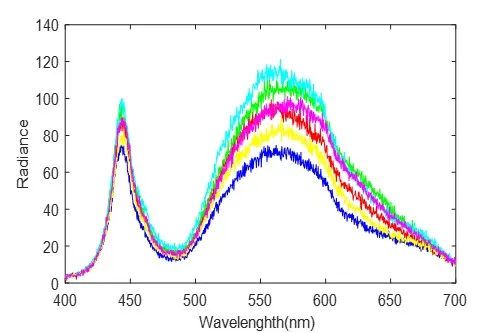 |
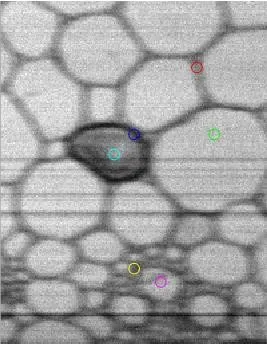
| Image display at 628.2 nm Spectral curve | Spectral curve |
●Trace forensic science research: Criminal investigation, evidence identification, cultural relic identification, jewelry and jade, disguise recognition, trace detection.
●Biomedical applications: Cell biology, oncology and pathogen identification, localization of protein crystals, determination of protein crystal purity.
●Industrial inspection: Semiconductor testing, smart manufacturing, quality control, color analysis of flat-panel display pixels.
●Astronomy and geography: Precision agriculture, remote sensing detection, mining exploration, ore inspection, measurement of vitrinite reflectance in coal.
●Agricultural production: Monitoring crop growth and pest diseases, crop selection, grading of agricultural products.
 |
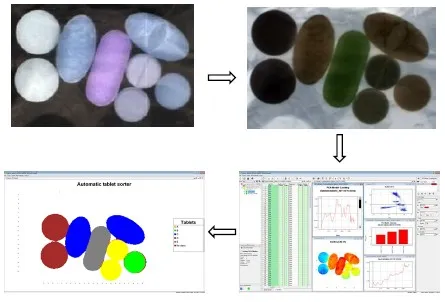 |
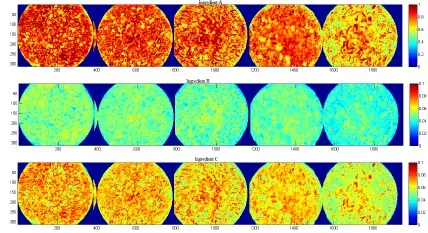
| Drug testing and component analysis | |
 |
 |
|
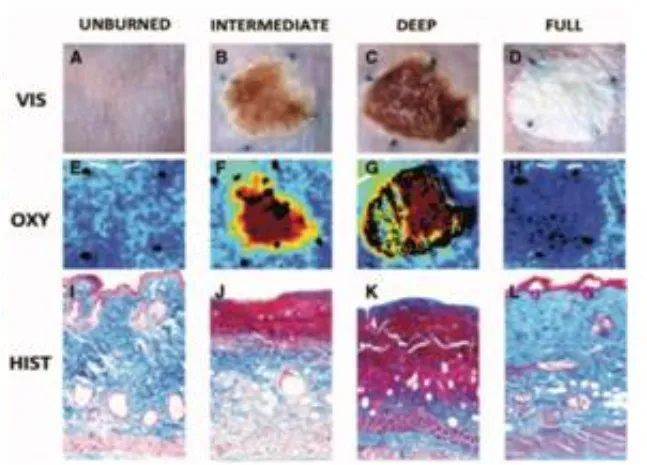
Oxygen saturation and hemoglobin distribution in burn areas op: Color imaging of burn skin on a nude mouse; Middle: Hyperspectral imaging analysis of oxygen and hemoglobin imaging; Bottom: Tissue section |
|
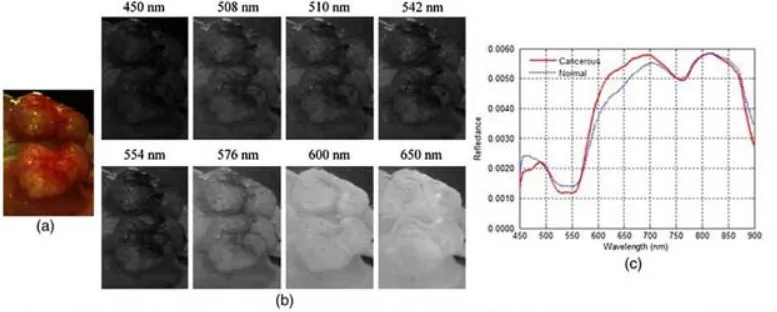
(a)Visualization of tumors without green fluorescent protein (GFP)
(b)(a) RGB pseudo-color of hyperspectral data (b) Preprocessed spectral image (c) Spectral curves of cancerous and healthy tissues
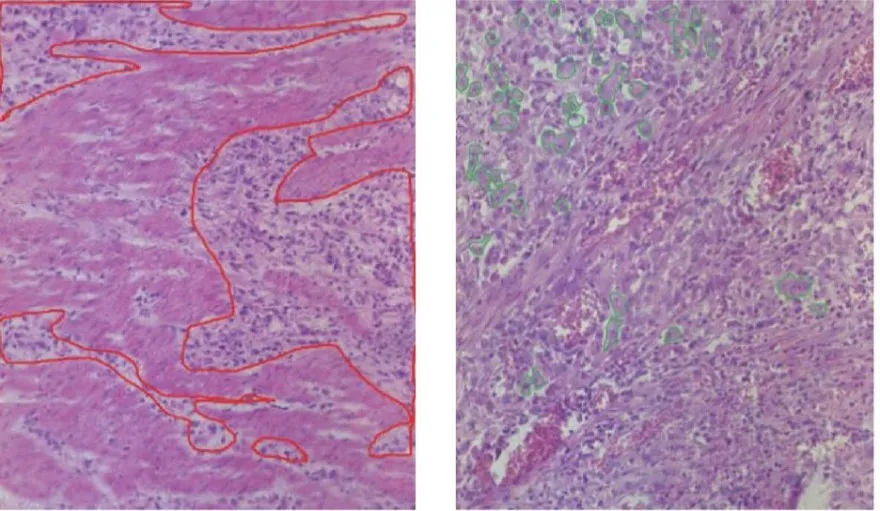
Gastric cancer tissue marking and gastric cancer cell markin
g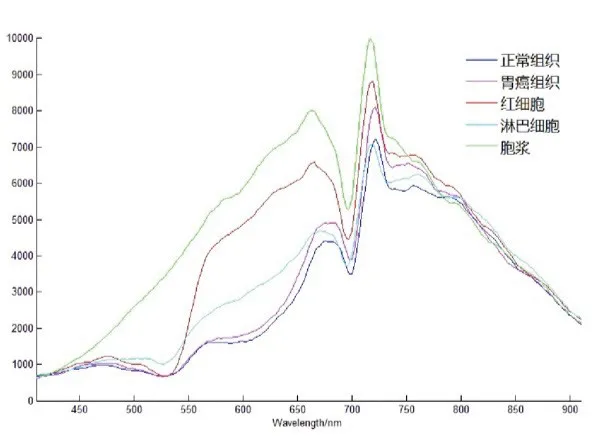
Spectral derivative comparison of gastric cancer tissue and normal tissue
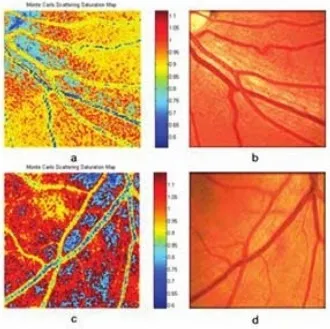
Blood oxygen saturation detection
(a) 29-year-old healthy female; (b) Zero-order color image of the left figure; (c) 58-year-old healthy male; (d) Zero-order color image of the left figure
Technical Advanced Features
● Capable of single-point spectrometry and imaging hyperspectrometry (configurable options), offering flexible expansion.
● Employs a research-grade metallographic microscope with a rich array of light sources, facilitating various Micro-Spectroscopy applications like transmission/reflection, fluorescence, Raman.
● Utilizes built-in push-broom spectral cameras with full-spectrum seamless scanning technology for high sensitivity and resolution.
● Real-time observation of images at various wavelengths, enabling rapid, convenient, and accurate acquisition of target spectral image data.
● Multiple observation modes (incident DIC, incident bright field, transmitted bright field, polarization, dark field) to meet diverse inspection requirements.
● The software includes data acquisition, image manipulation, spectral analysis, data processing functions, and a suite of adaptive algorithms (customizable options).
● Dedicated full-spectrum illumination sources support reflectance and transmittance dual-purpose standard calibration modules traceable to NIST standards.
● Visible light camera and hyperspectral in the same field of view, allowing clear observation and rapid focusing of the measurement area, and simultaneous acquisition of visible light photos and hyperspectral images.
● Configurable programmable electronic control displacement stage to realize spectral Mapping functionality, offering customized services according to user needs.
The iSpec-MS Micro-Spectroscopy imaging measurement system can be widely applied in fields such as nanomedicine delivery, nanotoxicology, nanomaterials, cell biology, pathology, virology, botany, and more.
|
|
Additionally, the iSpec-MS series Micro-Spectroscopy imaging system can be paired with a built-in push-broom hyperspectral camera independently developed by LiSen Optics. This utilizes spatial imaging full-spectrum seamless scanning technology to achieve hyperspectral collection of microscopic field samples, obtaining fine spatial images of the samples while also acquiring hyperspectral information. The iSpec-MS series can also be customized according to user needs with different spectral ranges, primarily 400-1000nm and 900-1700nm. The hyperspectral camera can choose CMOS/sCMOS/InGaAs detectors to meet different sensitivity and signal-to-noise ratio research needs.
False color patterns of carbon nanotubes on transparent glass show 17 different wavelengths
The microscope light source is richly configured, offering reflective/transmissive halogen light sources, ultraviolet light sources, and LED/LD fluorescence excitation light sources. This powerful and flexible system can be combined with Raman lasers and Raman spectrometers for micro Raman measurements. The spectrometer can use both cooled and uncooled research-grade spectrometers, covering spectral ranges of 200-1100nm/200-1700nm/200-2500nm. High sensitivity research-grade spectrometers use two-stage Peltier TE cooling technology, ensuring long-term stable operation and low noise levels. The optical interface of the research-grade metallographic microscope adopts a universal C-Mount interface adapter.
Hyperspectral microscopy displays nanoparticles in cells
LiSpecView, a multifunctional spectral acquisition software, can realize transmission, reflection, fluorescence, color, and other spectral information. It is an integrated software for spectral analysis, light source, displacement stage, color camera image analysis, and instrument control.
Software’s interface during Sample Measurement
Software’s interface during Sample Measurement
Typical Application
In a production environment, Micro-Spectroscopyimaging measurement systems can be used for quality control of everything from color masks in flat-panel displays to film thickness on semiconductor integrated circuits. Additionally, they are utilized for identifying and quantifying micro-scale samples, including applications in microfluidics, matching fibers or paints for forensic chemists, identifying gems or coal for geologists, measuring ink or paint colors for process chemists, and even analyzing great artworks for preservationists. In cell biology, these systems quantify nanomaterials in cells and tissues, providing both spectral analysis and image data of materials and biological samples.
|
|
|
Cross-section of a monocot stem Microphotography |
0-level magnification |
|
|
| Image display at 628.2 nm Spectral curve | Spectral curve |
●Trace forensic science research: Criminal investigation, evidence identification, cultural relic identification, jewelry and jade, disguise recognition, trace detection.
●Biomedical applications: Cell biology, oncology and pathogen identification, localization of protein crystals, determination of protein crystal purity.
●Industrial inspection: Semiconductor testing, smart manufacturing, quality control, color analysis of flat-panel display pixels.
●Astronomy and geography: Precision agriculture, remote sensing detection, mining exploration, ore inspection, measurement of vitrinite reflectance in coal.
●Agricultural production: Monitoring crop growth and pest diseases, crop selection, grading of agricultural products.
|
|
| Drug testing and component analysis | |
|
|
|
Oxygen saturation and hemoglobin distribution in burn areas op: Color imaging of burn skin on a nude mouse; Middle: Hyperspectral imaging analysis of oxygen and hemoglobin imaging; Bottom: Tissue section |
|
(a)Visualization of tumors without green fluorescent protein (GFP)
(b)(a) RGB pseudo-color of hyperspectral data (b) Preprocessed spectral image (c) Spectral curves of cancerous and healthy tissues
Gastric cancer tissue marking and gastric cancer cell markin
g
Spectral derivative comparison of gastric cancer tissue and normal tissue
Blood oxygen saturation detection
(a) 29-year-old healthy female; (b) Zero-order color image of the left figure; (c) 58-year-old healthy male; (d) Zero-order color image of the left figure
Technical Advanced Features
● Capable of single-point spectrometry and imaging hyperspectrometry (configurable options), offering flexible expansion.
● Employs a research-grade metallographic microscope with a rich array of light sources, facilitating various Micro-Spectroscopy applications like transmission/reflection, fluorescence, Raman.
● Utilizes built-in push-broom spectral cameras with full-spectrum seamless scanning technology for high sensitivity and resolution.
● Real-time observation of images at various wavelengths, enabling rapid, convenient, and accurate acquisition of target spectral image data.
● Multiple observation modes (incident DIC, incident bright field, transmitted bright field, polarization, dark field) to meet diverse inspection requirements.
● The software includes data acquisition, image manipulation, spectral analysis, data processing functions, and a suite of adaptive algorithms (customizable options).
● Dedicated full-spectrum illumination sources support reflectance and transmittance dual-purpose standard calibration modules traceable to NIST standards.
● Visible light camera and hyperspectral in the same field of view, allowing clear observation and rapid focusing of the measurement area, and simultaneous acquisition of visible light photos and hyperspectral images.
● Configurable programmable electronic control displacement stage to realize spectral Mapping functionality, offering customized services according to user needs.
![]() Main Technical Indicators
Main Technical Indicators
|
Model |
iSpec-MS-HS400 |
iSpec-MS-UVIR-1.7TEC |
iSpec-MS-UVIR-2.5TEC |
|
Type |
Microscopic transmission/reflection spectroscopy imaging system |
||
|
Spectral Range |
200-1100nm |
200-1700nm |
200-2500nm |
|
Spectrometer |
Array |
Cooled Linear Array CCD/InGaAs Detector |
Cooled Linear Array Detector |
|
Wavelength Sampling Interval |
0.6nm@200-1100nm |
0.6nm@200-1100nm |
0.6nm@200-1000nm |
|
Research-grade Metallographic Microscope |
Capable of bright field, polarization, dark field observation; polarizable; excitation and reception expansion modules; connectable to fiber optic light sources and non-imaging spectrometers, SMA905 interface; adjustable diaphragm for collecting light area. |
||
|
Light Source Type |
100W halogen light source/fluorescence excitation light source (365 / 460 / 525 nm)/mercury xenon light source/laser light source (wavelengths customizable according to user needs). |
||
|
Displacement Stage |
Manual/rotatable/programmable displacement stage (configurable options). |
||
|
Electronic Precision Displacement Stage Step/Precision |
0.01μm / 0.1μm / 1μm;±0.7μm / ±1μm / ±5μm |
||
|
Achromatic Objective Magnification/Resolution |
5X / 10X / 20X / 50X / 100X ; |
||
|
Polarization Module |
YES |
||
|
High Definition Camera/Resolution |
5 million pixels / 2592 X 1944 |
||
|
Functional Applications |
Transmission/reflection / fluorescence / Raman / hyperspectral micro-imaging |
||
|
Spectral Software |
LiSpecView spectral measurement software and hyperspectral processing software support spectral and image data preview, dynamic real-time display of hyperspectral images and spectral curves; synthesis of single-band, true/false color images; import, crop, export of hyperspectral images. Hyperspectral data format supports Envi and other third-party software, for processing like reflectance correction, radiometric correction, filtering, noise reduction, spectral and image data preview, cropping, data stitching, spectral angle classification algorithms, and supports user-defined algorithms. The software supports custom analysis model input function, custom band operation. Additionally, the hardware offers a secondary development software interface, allowing users to develop using the SDK. |
||
|
Model |
iSpec-MS-Hyper-VIS1000 |
iSpec-MS-Hyper-VIS-NIR |
|
Type |
Microscopic hyperspectral imaging system |
|
|
Spectral Range |
400-1000nm |
900-1700nm |
|
Spectrometer |
Built-In Push-Broom CMOS; Hyperspectral Camera |
Built-In Push-Broom InGaAs; Hyperspectral Camera |
|
Wavelength/Sampling Interval |
2nm@400-1000nm |
3nm@400-1000nm |
|
Full Frame Pixels |
1920 (spatial dimension) × 1200 (spectral dimension) |
320 (spatial dimension) × 256 (spectral dimension) |
|
Research-grade Metallographic Microscope |
Capable of bright field, polarization, dark field observation modes; polarizable; excitation and reception expansion modules; connectable to fiber optic light sources and non-imaging spectrometers, SMA905 interface; adjustable diaphragm for collecting light area. |
|
|
Light Source Type |
1100W halogen light source/fluorescence excitation light source (365 / 460 / 525 nm) /mercury xenon light source/laser light source (wavelengths customizable according to user needs). |
|
|
Displacement Stage |
Manual/rotatable/programmable displacement stage (configurable options). |
|
|
Electronic Precision Displacement Stage Step/Precision |
0.01μm / 0.1μm / 1μm;±0.7μm / ±1μm / ±5μm |
|
|
Achromatic Objective Magnification/Resolution |
5X / 10X / 20X / 50X / 100X; |
|
|
|
||
|
2.236μm / 1.118μm / 0.746μm / 0.419μm / 0.373μm (configurable options). |
||
|
Polarization Module |
YES |
|
|
High Definition Camera/Resolution |
5 million pixels / 2592 X 1944 |
|
|
Functional Applications |
Transmission/reflection / fluorescence / Raman / hyperspectral micro-imaging |
|
|
Spectral Software |
LiSpecView spectral measurement software and hyperspectral processing software support spectral and image data preview, dynamic real-time display of hyperspectral images and spectral curves; synthesis of single-band, true/false color images; import, crop, export of hyperspectral images. Hyperspectral data format supports Envi and other third-party software, for processing like reflectance correction, radiometric correction, filtering, noise reduction, spectral and image data preview, cropping, data stitching, spectral angle classification algorithms, and supports user-defined algorithms. The software supports custom analysis model input function, custom band operation. Additionally, the hardware offers a secondary development software interface, allowing users to develop using the SDK. |
|
|
Model |
iSpec-MS-Hyper-VIS1000 |
iSpec-MS-Hyper-VIS-NIR |
|
Type |
Microscopic hyperspectral imaging system |
|
|
Spectral Range |
400-1000nm |
900-1700nm |
|
Spectrometer |
Built-In Push-Broom CMOS; Hyperspectral Camera |
Built-In Push-Broom InGaAs; Hyperspectral Camera |
|
Wavelength/Sampling Interval |
2nm@400-1000nm |
3nm@400-1000nm |
|
Full Frame Pixels |
1920 (spatial dimension) × 1200 (spectral dimension) |
320 (spatial dimension) × 256 (spectral dimension) |
|
Research-grade Metallographic Microscope |
Capable of bright field, polarization, dark field observation modes; polarizable; excitation and reception expansion modules; connectable to fiber optic light sources and non-imaging spectrometers, SMA905 interface; adjustable diaphragm for collecting light area. |
|
|
Light Source Type |
1100W halogen light source/fluorescence excitation light source (365 / 460 / 525 nm) /mercury xenon light source/laser light source (wavelengths customizable according to user needs). |
|
|
Displacement Stage |
Manual/rotatable/programmable displacement stage (configurable options). |
|
|
Electronic Precision Displacement Stage Step/Precision |
0.01μm / 0.1μm / 1μm;±0.7μm / ±1μm / ±5μm |
|
|
Achromatic Objective Magnification/Resolution |
5X / 10X / 20X / 50X / 100X; |
|
|
|
||
|
2.236μm / 1.118μm / 0.746μm / 0.419μm / 0.373μm (configurable options). |
||
|
Polarization Module |
YES |
|
|
High Definition Camera/Resolution |
5 million pixels / 2592 X 1944 |
|
|
Functional Applications |
Transmission/reflection / fluorescence / Raman / hyperspectral micro-imaging |
|
|
Spectral Software |
LiSpecView spectral measurement software and hyperspectral processing software support spectral and image data preview, dynamic real-time display of hyperspectral images and spectral curves; synthesis of single-band, true/false color images; import, crop, export of hyperspectral images. Hyperspectral data format supports Envi and other third-party software, for processing like reflectance correction, radiometric correction, filtering, noise reduction, spectral and image data preview, cropping, data stitching, spectral angle classification algorithms, and supports user-defined algorithms. The software supports custom analysis model input function, custom band operation. Additionally, the hardware offers a secondary development software interface, allowing users to develop using the SDK. |
|
Get Your Free Spectral Analysis Solution.
Tell us about your requirements. Our experts will contact you within 24 hours.
Focus on spectral sensing and optoelectronic application systems