Get Your Free Spectral Analysis Solution.
Tell us about your requirements. Our experts will contact you within 24 hours.
In the development of new luminescent materials, enhancing their photoluminescence efficiency is crucial. Improving the quantum efficiency of luminescent materials requires precise quantum efficiency measurement techniques. The iSpecRad-PQY Photoluminescence Quantum Efficiency Measurement System by LiSen Optics is designed for effective measurement of the photoluminescence characteristics of devices. It can be assembled inside a glove box, allowing for in-situ measurements without the need to remove the sample.
In the development of new luminescent materials, enhancing their photoluminescence efficiency is crucial. Improving the quantum efficiency of luminescent materials requires precise quantum efficiency measurement techniques. The iSpecRad-PQY Photoluminescence Quantum Efficiency Measurement System by LiSen Optics is designed for effective measurement of the photoluminescence characteristics of devices. It can be assembled inside a glove box, allowing for in-situ measurements without the need to remove the sample.
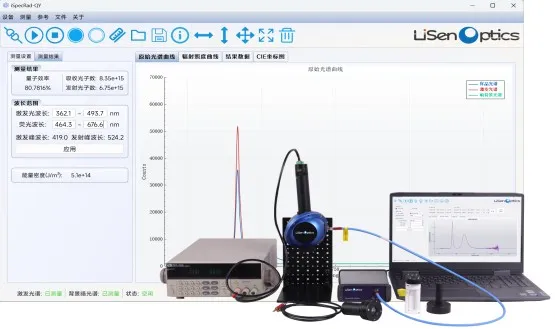
The system includes a spectrometer, integrating sphere with a calibrated radiation source, laser light source, optical fibers, and accompanying fixtures. The LiSen Optics spectrometer has a high signal-to-noise ratio, low stray light, and a broad dynamic range, making it suitable for measuring different wavelengths and intensities of excitation and emission light. The system also includes powerful, dedicated testing software, which is simple to use and facilitates quick and convenient testing processes.
The iSpecRad-PQY system supports the measurement of powder, thin film, and liquid samples, and is applicable in fields such as organometallic complexes, fluorescent probes, dye-sensitized PV materials, OLED materials, LED phosphors, etc.
Basic Principle
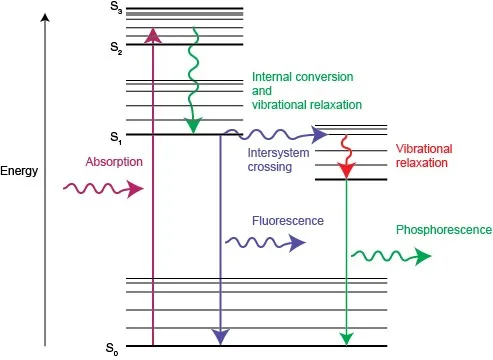
The absorption and emission energy diagram for fluorescence and phosphorescence
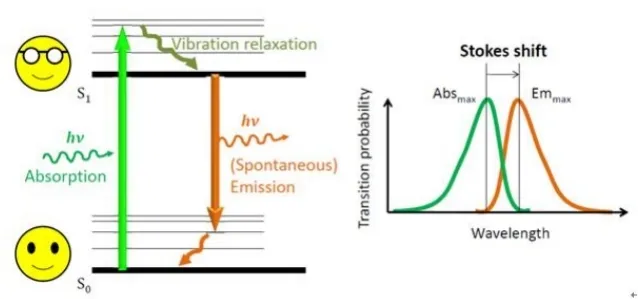
The energy diagram for fluorescence and phosphorescence absorption and emission processes describes the electronic energy levels of typical organic molecules and the electronic transitions between these levels. S0, S1, and T1 represent the ground state, lowest singlet, and lowest triplet states, respectively. After photoexcitation, excited-state molecules can return to the ground state through various radiative (involving light emission, like fluorescence and phosphorescence) and non-radiative (internal conversion and intersystem crossing) processes. Radiative and non-radiative processes compete with each other.
The absorption and emission energy diagram for fluorescence and phosphorescence explains the process of electron transitions in ordinary organic molecules. The energy levels S0, S1, and T1 represent the ground state, the lowest singlet state, and the lowest triplet state, respectively. After photoexcitation, excited-state molecules can return to the ground state via several transition paths, including radiative processes (like fluorescence and phosphorescence) and non-radiative processes (internal conversion and intersystem crossing). These radiative and non-radiative processes compete with each other.
Photoluminescence (PL) refers to the phenomenon where a material absorbs photons (or electromagnetic waves) and re-emits photons. This process includes both fluorescence and phosphorescence emissions. Quantum mechanically, this process can be described as the material absorbing a photon to transition to a higher excited state and then returning to a lower energy state, emitting a photon in the process. Photoluminescence is one form of fluorescence.
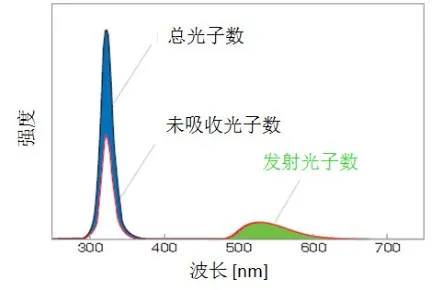
In current research on photoluminescent materials, the calculation of fluorescence quantum efficiency is crucial as it reflects the light-emitting capability of the materials. Fluorescence quantum efficiency, also known as quantum yield of fluorescence or fluorescence efficiency, is an important characteristic. Typically, the quantum yield is calculated by first exposing a blank container to the excitation light to obtain the total photon count. Then, a sample is placed in the container and exposed to the excitation light to determine the number of unabsorbed photons and emitted photons. The absolute Photoluminescence Quantum Yield (PLQY) is calculated by the ratio of emitted photons (in the green area)
to absorbed photons (in the blue area) per unit time (second), expressed as:
Photoluminescence
There are two methods to measure the quantum yield of a sample
1.Relative Quantum Yield Measurement: Requires a standard material with a known quantum yield for reference. The quantum yield of the sample is calculated by comparing the absorbance and fluorescence of the standard material and the sample. This method is only applicable to liquid samples.
2.Absolute Quantum Yield Measurement: Does not require a standard sample for comparison and is broadly applicable to liquids, films, and powder samples. This method involves using an integrating sphere accessory; the inner surface of the integrating sphere is generally coated with highly reflective materials like barium sulfate or polytetrafluoroethylene (PTFE). The excitation light or emitted light from all directions of the sample surface is homogenized by the integrating sphere before exiting and being detected by a spectrometer.
Method for Testing Absolute Fluorescence Quantum Yield
The system includes a spectrometer, integrating sphere with a calibrated radiation source, laser light source, optical fibers, and accompanying fixtures. The LiSen Optics spectrometer has a high signal-to-noise ratio, low stray light, and a broad dynamic range, making it suitable for measuring different wavelengths and intensities of excitation and emission light. The system also includes powerful, dedicated testing software, which is simple to use and facilitates quick and convenient testing processes.
The iSpecRad-PQY system supports the measurement of powder, thin film, and liquid samples, and is applicable in fields such as organometallic complexes, fluorescent probes, dye-sensitized PV materials, OLED materials, LED phosphors, etc.
Basic Principle
The absorption and emission energy diagram for fluorescence and phosphorescence
The energy diagram for fluorescence and phosphorescence absorption and emission processes describes the electronic energy levels of typical organic molecules and the electronic transitions between these levels. S0, S1, and T1 represent the ground state, lowest singlet, and lowest triplet states, respectively. After photoexcitation, excited-state molecules can return to the ground state through various radiative (involving light emission, like fluorescence and phosphorescence) and non-radiative (internal conversion and intersystem crossing) processes. Radiative and non-radiative processes compete with each other.
The absorption and emission energy diagram for fluorescence and phosphorescence explains the process of electron transitions in ordinary organic molecules. The energy levels S0, S1, and T1 represent the ground state, the lowest singlet state, and the lowest triplet state, respectively. After photoexcitation, excited-state molecules can return to the ground state via several transition paths, including radiative processes (like fluorescence and phosphorescence) and non-radiative processes (internal conversion and intersystem crossing). These radiative and non-radiative processes compete with each other.
Photoluminescence (PL) refers to the phenomenon where a material absorbs photons (or electromagnetic waves) and re-emits photons. This process includes both fluorescence and phosphorescence emissions. Quantum mechanically, this process can be described as the material absorbing a photon to transition to a higher excited state and then returning to a lower energy state, emitting a photon in the process. Photoluminescence is one form of fluorescence.
In current research on photoluminescent materials, the calculation of fluorescence quantum efficiency is crucial as it reflects the light-emitting capability of the materials. Fluorescence quantum efficiency, also known as quantum yield of fluorescence or fluorescence efficiency, is an important characteristic. Typically, the quantum yield is calculated by first exposing a blank container to the excitation light to obtain the total photon count. Then, a sample is placed in the container and exposed to the excitation light to determine the number of unabsorbed photons and emitted photons. The absolute Photoluminescence Quantum Yield (PLQY) is calculated by the ratio of emitted photons (in the green area)
to absorbed photons (in the blue area) per unit time (second), expressed as:
Photoluminescence
There are two methods to measure the quantum yield of a sample
1.Relative Quantum Yield Measurement: Requires a standard material with a known quantum yield for reference. The quantum yield of the sample is calculated by comparing the absorbance and fluorescence of the standard material and the sample. This method is only applicable to liquid samples.
2.Absolute Quantum Yield Measurement: Does not require a standard sample for comparison and is broadly applicable to liquids, films, and powder samples. This method involves using an integrating sphere accessory; the inner surface of the integrating sphere is generally coated with highly reflective materials like barium sulfate or polytetrafluoroethylene (PTFE). The excitation light or emitted light from all directions of the sample surface is homogenized by the integrating sphere before exiting and being detected by a spectrometer.
Method for Testing Absolute Fluorescence Quantum Yield
Typical Applications
● Inorganic and organic photoluminescence
● Measurement of organometallic complexes and coordination compound compounds
● Dye-sensitized PV materials, OLED materials
● Quantum efficiency measurement of LED and organic EL phosphors
● Quantum efficiency measurement of film samples for transmission fluorescence/reflection fluorescence (non-contact fluorescent phosphor samples, etc.)
● Fluorescence measurement of Quantum Dots, fluorescent probes (probes), biomaterials, encapsulation compounds, etc.
● Quantum efficiency measurement of dye-sensitized solar cells
● Full-featured: Suitable for measurement and analysis of powders, solutions, solids, and film samples.
● In-situ Measurement: Can be placed in a glove box for in-situ measurements.
● Structural Stability: The device does not require frequent calibration.
● Excitation Light Source: Grating combined with optical filters for wavelength selection.
● Professional Software: One-click operation, simple, and rapid testing.
● Spectrometer: The system uses a cooled CCD with a high signal-to-noise ratio, high sensitivity, and high measurement accuracy.
Main Technical Indicators
|
Model |
iSpecPQE-HR400 |
iSpecPQE-HS400 |
iSpecPQE-HSR4000TEC |
iSpecPQE-NIR4000-1.7TEC |
|
Spectrometer Type |
High-Resolution Spectrometer |
High-Sensitivity Spectrometer |
Scientific-Grade Thermoelectrically Cooled Spectrometer |
Cooled Near-Infrared Spectrometer |
|
Spectral Range |
200-1100nm |
200-1100nm |
200-1100nm |
900-1700nm |
|
Slit |
Standard 50μm (Other options: 100/200μm available) |
|||
|
Signal-to-Noise Ratio (SNR) |
600:01:00 |
500:01:00 |
12000:1 |
3000:1 (High Gain) 4700:1 (Low Gain) |
|
Detector |
Hamamatsu S11639, 2048-pixel linear CMOS |
S10420, 2048-pixel back-illuminated 2D CCD |
Hamamatsu S11820, thermoelectrically cooled, back-illuminated 2048-pixel 2D CCD |
Hamamatsu G11620, thermoelectrically cooled, 256-pixel linear InGaAs |
|
Cooling Temperature |
/ |
/ |
25°C below ambient temperature |
25°C below ambient temperature |
|
Integration Time |
0.5ms-65s |
7ms-60s |
5ms-24s |
100μs-10s |
|
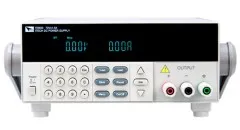
DC Power Supply |
ITECH IT6822L, Voltage: 0-32V, Current: 0-3A, Power: 96W, Overvoltage Protection: 0-33V |
|||
|
Optical Fiber |
UV optical fiber, 600μm core diameter, NA: 0.22, length: 1m, encapsulated in engineering silicone |
|||
|
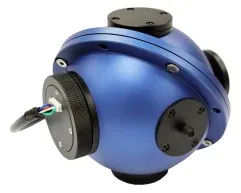
Integrating Sphere |
3.3-inch 4-port integrating sphere, Spectral range: 200-2500nm, PTFE high reflectivity >98% |
|||
|
Radiation Calibration Halogen Lamp |
NIM traceable radiation calibration source, Spectral range: 350-1100nm, with irradiance distribution traceable calibration data, Voltage: 6V; Power: 5W; Phoenix terminal to banana plug 2-pin connector |
|||
|
LED Excitation Source |
Standard LED-365nm, other LED excitation wavelengths from 365-1100nm available as options |
|||
|
Main Standard Accessories |
Integrating sphere mounting plate, solid cuvette holder and solid cuvette (liquid cuvette optional) |
|||
|
iSpecQE Quantum Efficiency Software |
Software features: Measure photoluminescence quantum efficiency; Measure incident photon count and emitted photon count; Select excitation peak and emission peak; Show energy density; Configure spectrometer parameters; Perform single and continuous measurements; Display raw spectrum and irradiance spectrum; Show CIE color coordinates chart; Show fluorescence color tristimulus values; Display chromaticity coordinates; Display fluorescent RGB colors; Show fluorescent color temperature; Data saving capabilities. |
|||
Typical Applications
● Inorganic and organic photoluminescence
● Measurement of organometallic complexes and coordination compound compounds
● Dye-sensitized PV materials, OLED materials
● Quantum efficiency measurement of LED and organic EL phosphors
● Quantum efficiency measurement of film samples for transmission fluorescence/reflection fluorescence (non-contact fluorescent phosphor samples, etc.)
● Fluorescence measurement of Quantum Dots, fluorescent probes (probes), biomaterials, encapsulation compounds, etc.
● Quantum efficiency measurement of dye-sensitized solar cells
● Full-featured: Suitable for measurement and analysis of powders, solutions, solids, and film samples.
● In-situ Measurement: Can be placed in a glove box for in-situ measurements.
● Structural Stability: The device does not require frequent calibration.
● Excitation Light Source: Grating combined with optical filters for wavelength selection.
● Professional Software: One-click operation, simple, and rapid testing.
● Spectrometer: The system uses a cooled CCD with a high signal-to-noise ratio, high sensitivity, and high measurement accuracy.
Main Technical Indicators
|
Model |
iSpecPQE-HR400 |
iSpecPQE-HS400 |
iSpecPQE-HSR4000TEC |
iSpecPQE-NIR4000-1.7TEC |
|
Spectrometer Type |
High-Resolution Spectrometer |
High-Sensitivity Spectrometer |
Scientific-Grade Thermoelectrically Cooled Spectrometer |
Cooled Near-Infrared Spectrometer |
|
Spectral Range |
200-1100nm |
200-1100nm |
200-1100nm |
900-1700nm |
|
Slit |
Standard 50μm (Other options: 100/200μm available) |
|||
|
Signal-to-Noise Ratio (SNR) |
600:01:00 |
500:01:00 |
12000:1 |
3000:1 (High Gain) 4700:1 (Low Gain) |
|
Detector |
Hamamatsu S11639, 2048-pixel linear CMOS |
S10420, 2048-pixel back-illuminated 2D CCD |
Hamamatsu S11820, thermoelectrically cooled, back-illuminated 2048-pixel 2D CCD |
Hamamatsu G11620, thermoelectrically cooled, 256-pixel linear InGaAs |
|
Cooling Temperature |
/ |
/ |
25°C below ambient temperature |
25°C below ambient temperature |
|
Integration Time |
0.5ms-65s |
7ms-60s |
5ms-24s |
100μs-10s |
|
DC Power Supply |
ITECH IT6822L, Voltage: 0-32V, Current: 0-3A, Power: 96W, Overvoltage Protection: 0-33V |
|||
|
Optical Fiber |
UV optical fiber, 600μm core diameter, NA: 0.22, length: 1m, encapsulated in engineering silicone |
|||
|
Integrating Sphere |
3.3-inch 4-port integrating sphere, Spectral range: 200-2500nm, PTFE high reflectivity >98% |
|||
|
Radiation Calibration Halogen Lamp |
NIM traceable radiation calibration source, Spectral range: 350-1100nm, with irradiance distribution traceable calibration data, Voltage: 6V; Power: 5W; Phoenix terminal to banana plug 2-pin connector |
|||
|
LED Excitation Source |
Standard LED-365nm, other LED excitation wavelengths from 365-1100nm available as options |
|||
|
Main Standard Accessories |
Integrating sphere mounting plate, solid cuvette holder and solid cuvette (liquid cuvette optional) |
|||
|
iSpecQE Quantum Efficiency Software |
Software features: Measure photoluminescence quantum efficiency; Measure incident photon count and emitted photon count; Select excitation peak and emission peak; Show energy density; Configure spectrometer parameters; Perform single and continuous measurements; Display raw spectrum and irradiance spectrum; Show CIE color coordinates chart; Show fluorescence color tristimulus values; Display chromaticity coordinates; Display fluorescent RGB colors; Show fluorescent color temperature; Data saving capabilities. |
|||
Accessories
|
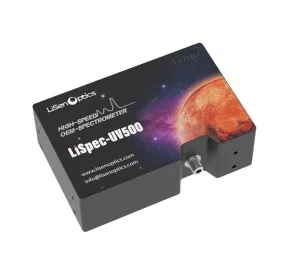
● LiSpec-UV500 1. Spectral Range: 300-1100 nm 2. Slit: 50 μm (Standard, Optional 100 μm, 200 μm) 3. Signal-to-Noise Ratio: 350:1 4. Detector: Hamamatsu S11639 Line Array 2048-pixel CMOS 5. Integration Time: 0.5 ms - 65 s |
|
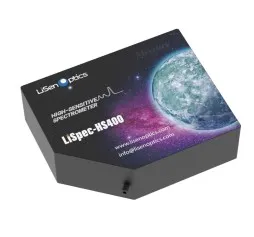
● LiSpec-HS400 1. Spectral Range: 200-1100 nm 2. Slit: 50 μm (Standard, Optional 100 μm, 200 μm) 3. Signal-to-Noise Ratio: 500:1 4. Detector: S10420 2048-pixel Back-illuminated Area CCD 5. Integration Time: 7 ms - 60 s |
|
|
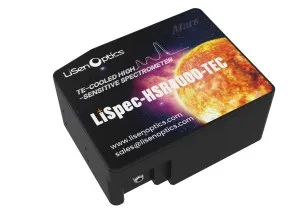
● LiSpec-HSR4000TEC 1. Spectral Range: 200-1100 nm 2. Slit: 50 μm (Standard, Optional 100 μm, 200 μm) 3. Signal-to-Noise Ratio: 12000:1 4. Detector: Hamamatsu S11820 Thermoelectric Cooled Back-illuminated 2048-pixel Area CCD 5. Cooling Temperature: -25°C Relative to Ambient Temperature 6. Integration Time: 5 ms - 24 s |
|
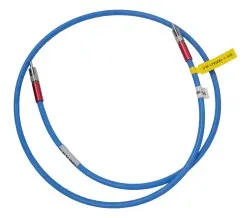
● Optical Fiber 1. Type: UV Fiber 2. Spectral Range: 250-1100 nm 3. NA: 0.22 4. Core Diameter: 600 μm 5. Length: 1 meter 6. Encapsulation: 6 mm Built-in Armor Engineering Silicone Encapsulation 7. Connector: SMA905 |
|
|
● DC Power Supply 1. Voltage: 0-32 V 2. Current: 0-3 A 3. Power: 96 W 4. Over-voltage Protection: 0-33 V |
|
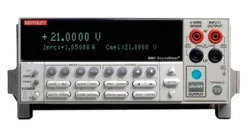
● Source Meter 1. Channels: 1 2. Current: 0-1 A 3. Voltage: 0-200 V 4. Measurement Resolution: 1 pA / 100 nV 5. Power: 20 W |
|
|
● Integrating Sphere (for Electroluminescence) 1. Size: 3.3 inches 2. Ports: 4-port Integrating Sphere 3. Reflectivity: >98% PTFE High Reflectance Spectral Range: 200-2500 nm |
|
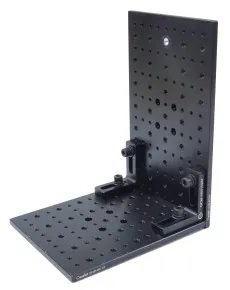
● Integrating Sphere Fixing Plate 1. Base Plate Size: 200 * 125 * 20 mm 2. Side Plate Size: 125 * 150 * 6 mm 3. Structure: Consists of two optical plates forming an L-shaped fixture to stabilize the integrating sphere (for solid/liquid measurements) |
|
|
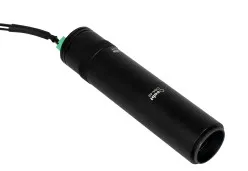
● Radiometric Calibration Halogen Light Source 1. Traceability: NIM Radiometric Calibration 2. Spectral Range: 350-1100 nm 3. Calibrated Data: Irradiance Distribution Traceability 4. Size: Φ30.4 * 56.1 mm 5. Connection: Φ45 * 24.9 mm 6. Voltage: 6V 7. Power: 5W |
|
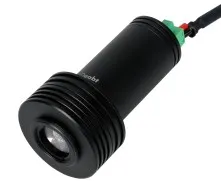
● LED Excitation Light Source 1.Appearance Size: Φ30.4 * 127.4 mm 2.Excitation Light Source Wavelength (Standard Configuration): 365 nm: 3.6V, 5W; 420 nm: 3.3V, 3W (Other LED excitation wavelengths from 365-1100 nm can be customized) Connector Line: Phoenix terminal 2-pin to banana plug 2-pin |
|
|
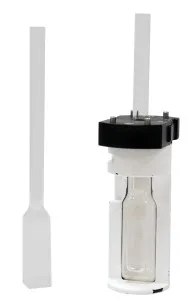
● Liquid Cuvette 1. Traceability: NIM Radiometric Calibration 2. Spectral Range: 350-1100 nm 3. Calibrated Data: Irradiance Distribution Traceability 4. Size: Φ30.4 * 56.1 mm 5. Connection: Φ45 * 24.9 mm 6. Voltage: 6V 7. Power: 5W |
|
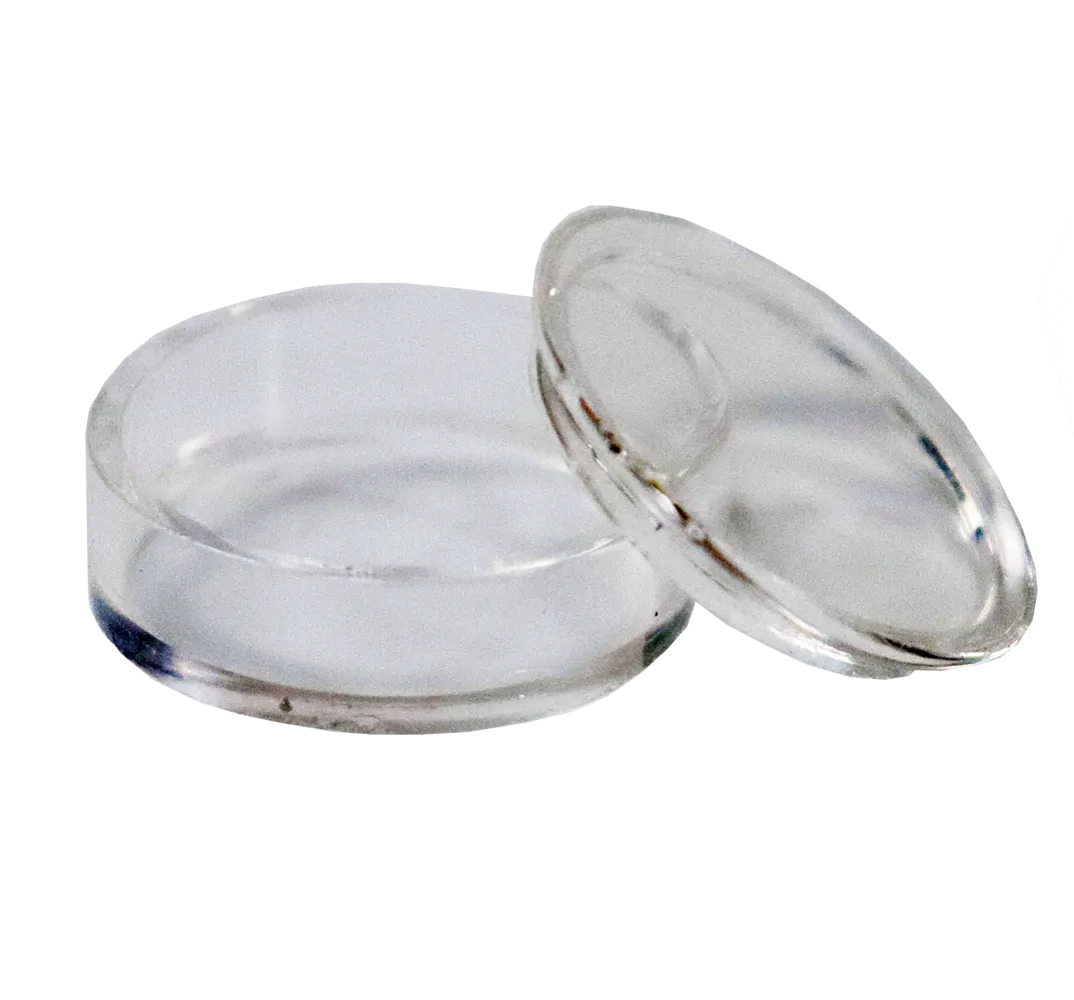
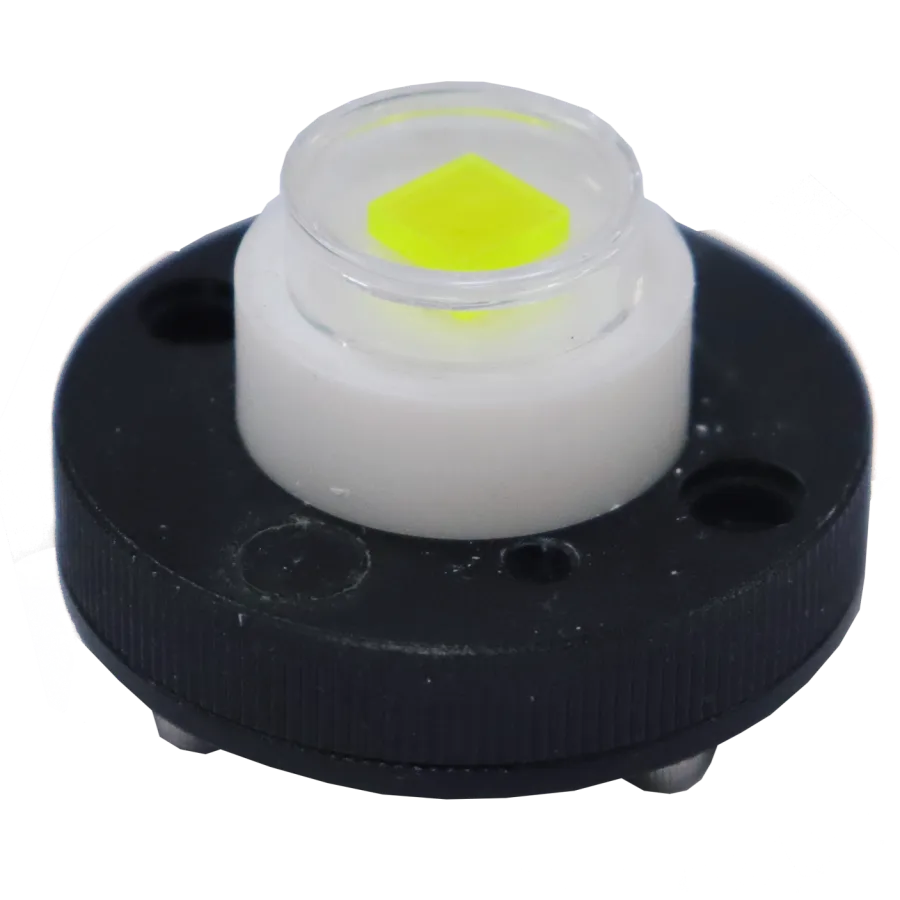
● Solid Cuvette 1. Size: Φ17 * 5 mm, capacity 0.7 ml, optical path length 10 mm, applicable wavelength 200 nm-2500 nm 2.Maximum External Dimensions: Φ40 * 17.8 mm 3.Cuvette Slot Size: φ17.2 * 1 mm Usage: For holding solid and powder samples |
|
|
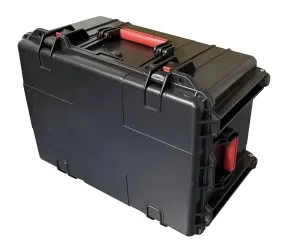
● Portable Instrument Case 1. Size: 613 mm (Length) × 460 mm (Width) × 320 mm (Height) 2. Purpose: For storing the entire set of instruments |
|
||
Accessories
|
● LiSpec-UV500 1. Spectral Range: 300-1100 nm 2. Slit: 50 μm (Standard, Optional 100 μm, 200 μm) 3. Signal-to-Noise Ratio: 350:1 4. Detector: Hamamatsu S11639 Line Array 2048-pixel CMOS 5. Integration Time: 0.5 ms - 65 s |
|
● LiSpec-HS400 1. Spectral Range: 200-1100 nm 2. Slit: 50 μm (Standard, Optional 100 μm, 200 μm) 3. Signal-to-Noise Ratio: 500:1 4. Detector: S10420 2048-pixel Back-illuminated Area CCD 5. Integration Time: 7 ms - 60 s |
|
|
● LiSpec-HSR4000TEC 1. Spectral Range: 200-1100 nm 2. Slit: 50 μm (Standard, Optional 100 μm, 200 μm) 3. Signal-to-Noise Ratio: 12000:1 4. Detector: Hamamatsu S11820 Thermoelectric Cooled Back-illuminated 2048-pixel Area CCD 5. Cooling Temperature: -25°C Relative to Ambient Temperature 6. Integration Time: 5 ms - 24 s |
|
● Optical Fiber 1. Type: UV Fiber 2. Spectral Range: 250-1100 nm 3. NA: 0.22 4. Core Diameter: 600 μm 5. Length: 1 meter 6. Encapsulation: 6 mm Built-in Armor Engineering Silicone Encapsulation 7. Connector: SMA905 |
|
|
● DC Power Supply 1. Voltage: 0-32 V 2. Current: 0-3 A 3. Power: 96 W 4. Over-voltage Protection: 0-33 V |
|
● Source Meter 1. Channels: 1 2. Current: 0-1 A 3. Voltage: 0-200 V 4. Measurement Resolution: 1 pA / 100 nV 5. Power: 20 W |
|
|
● Integrating Sphere (for Electroluminescence) 1. Size: 3.3 inches 2. Ports: 4-port Integrating Sphere 3. Reflectivity: >98% PTFE High Reflectance Spectral Range: 200-2500 nm |
|
● Integrating Sphere Fixing Plate 1. Base Plate Size: 200 * 125 * 20 mm 2. Side Plate Size: 125 * 150 * 6 mm 3. Structure: Consists of two optical plates forming an L-shaped fixture to stabilize the integrating sphere (for solid/liquid measurements) |
|
|
● Radiometric Calibration Halogen Light Source 1. Traceability: NIM Radiometric Calibration 2. Spectral Range: 350-1100 nm 3. Calibrated Data: Irradiance Distribution Traceability 4. Size: Φ30.4 * 56.1 mm 5. Connection: Φ45 * 24.9 mm 6. Voltage: 6V 7. Power: 5W |
|
● LED Excitation Light Source 1.Appearance Size: Φ30.4 * 127.4 mm 2.Excitation Light Source Wavelength (Standard Configuration): 365 nm: 3.6V, 5W; 420 nm: 3.3V, 3W (Other LED excitation wavelengths from 365-1100 nm can be customized) Connector Line: Phoenix terminal 2-pin to banana plug 2-pin |
|
|
● Liquid Cuvette 1. Traceability: NIM Radiometric Calibration 2. Spectral Range: 350-1100 nm 3. Calibrated Data: Irradiance Distribution Traceability 4. Size: Φ30.4 * 56.1 mm 5. Connection: Φ45 * 24.9 mm 6. Voltage: 6V 7. Power: 5W |
|
● Solid Cuvette 1. Size: Φ17 * 5 mm, capacity 0.7 ml, optical path length 10 mm, applicable wavelength 200 nm-2500 nm 2.Maximum External Dimensions: Φ40 * 17.8 mm 3.Cuvette Slot Size: φ17.2 * 1 mm Usage: For holding solid and powder samples |
|
|
● Portable Instrument Case 1. Size: 613 mm (Length) × 460 mm (Width) × 320 mm (Height) 2. Purpose: For storing the entire set of instruments |
|
||
Get Your Free Spectral Analysis Solution.
Tell us about your requirements. Our experts will contact you within 24 hours.
Focus on spectral sensing and optoelectronic application systems