
Focus on spectral sensing and optoelectronic application systems
Hyperspectral Imaging System Field Spectrometer
Time:2025-01-14
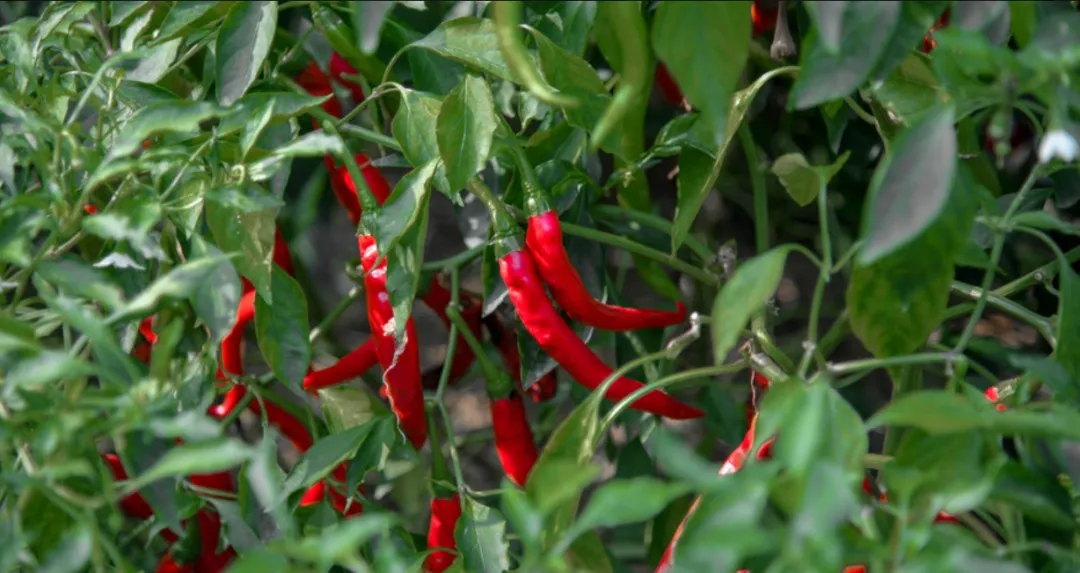
Abstract:This study focuses on chili peppers cultivated in Zunyi City, Guizhou Province. Field data collection included measuring SPAD values of chili pepper leaves during the peak fruiting stage and acquiring near-ground hyperspectral data as well as low-altitude UAV hyperspectral data. By extracting the spectral reflectance of chili pepper leaves from the hyperspectral data, preprocessing the data, and performing correlation analysis, a vegetation index highly correlated with the chlorophyll content of chili pepper leaves was developed.
Estimating Chlorophyll Content in Chili Pepper Leaves Based on Hyperspectral Remote Sensing Data
1、Introduction
The growth condition of chili peppers directly impacts their quality and economic value, making real-time monitoring of their growth essential. This monitoring is a prerequisite for ensuring the scientific cultivation of chili peppers. Chlorophyll, as the primary substance involved in photosynthesis, plays a critical role in this process, and its content can be used as an important indicator of plant health.
UAV-based hyperspectral remote sensing and near-ground hyperspectral technologies offer unique advantages in monitoring crop growth, classification, and other related fields. These technologies are fast, efficient, convenient, and capable of covering large areas, allowing for continuous and dynamic vegetation monitoring. They hold significant promise in research involving the rapid acquisition of large volumes of phenotypic data. Researchers have applied hyperspectral technology to retrieve vegetation parameters, enabling rapid, non-destructive monitoring of vegetation.
In this study, chili peppers were chosen as the research subject, and field experiments were conducted based on different chili varieties. Ground-based hyperspectral data, UAV hyperspectral data, and leaf SPAD values were measured. By leveraging the spectral characteristics of these two platforms, optimized spectral parameters were developed to reveal the impact and underlying relationships of different datasets on chlorophyll content estimation. A SPAD regression model based on machine learning algorithms was then established, leading to the development of a chlorophyll content estimation model tailored for chili pepper leaves in this study area. The findings have scientific significance and practical value for the scientific cultivation of chili peppers in the Guizhou region.
2、Experimental Design and Analysis Methods
2.1 Typical Ground Object Spectral Characteristics
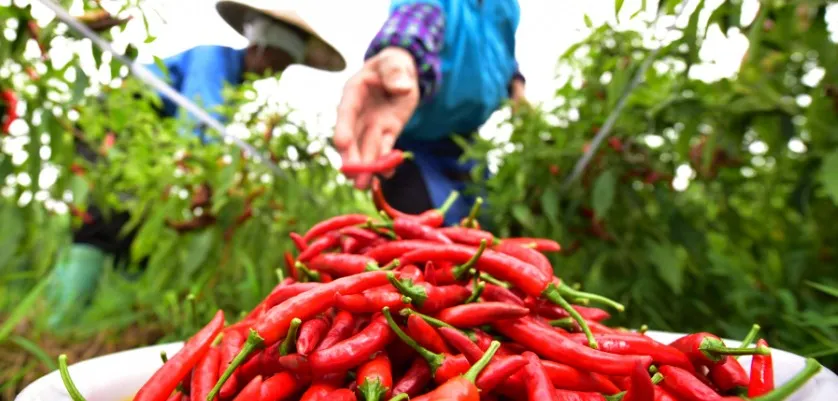
The study area is located at the Guizhou Academy of Agricultural Sciences Chili Pepper Research Institute's Guanzhuang Demonstration Base in Xinpu New District, Zunyi City, Guizhou Province (E104°18′20″, N25°19′44″, as shown in Figure 2-1). Zunyi City, known for its diverse chili pepper varieties and high nutritional value, has been honored with the title of "World Chili Capital" by the World Chili Alliance.
Zunyi is situated in northern Guizhou Province, on the northeastern edge of the Yunnan-Guizhou Plateau, approximately 140 kilometers south of the provincial capital, Guiyang. Covering a total area of 30,762 square kilometers, the study area is characterized by a mid-subtropical humid monsoon climate of the plateau. The region experiences distinct seasons, with hot and rainy periods coinciding, and has a long frost-free period of about 250 to 350 days. The annual average temperature is 15.1°C, with sunshine duration ranging from 23% to 29%, ensuring ample sunlight. The area also receives abundant rainfall, with an annual average precipitation ranging between 900mm and 1200mm, varying from 800mm to 1600mm. These conditions provide a natural advantage for chili pepper cultivation.
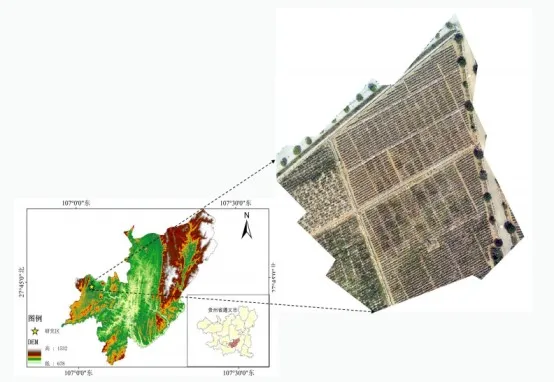
Figure 2-1 Location Map of the Study Area
2.2 Hyperspectral Data Acquisition
2.2.1 Ground-Based Non-Imaging Spectral Data Acquisition
The spectral measurements were conducted on chili pepper leaves during the peak fruiting stage using a portable field spectrometer. Measurements were taken under favorable weather conditions, between 10:00 AM and 3:00 PM. To avoid light pollution, the personnel conducting the measurements wore dark-colored clothing.
The measurement process was as follows: The spectrometer probe was oriented downward and positioned approximately 15 to 30 cm above the plant canopy. Every five plants, a standard white reference panel calibration was performed. For each plant, five measurements were taken, and the average value was used as the final reflectance. The spectral range measured in this study was between 350 nm and 2500 nm, covering a total of 2151 bands. Due to the influence of water absorption bands at 1400 nm and 1900 nm, and given that previous studies have shown chlorophyll response bands to be within the visible and near-infrared ranges, this study focused on the spectral range from 350 nm to 1300 nm for chlorophyll analysis using the hyperspectral data.
2.2.2 Low-Altitude Imaging Hyperspectral Data Acquisition
A hyperspectral imaging system was used to collect image data of the study area on the morning of September 8, 2021, between 11:00 AM and 12:00 PM. The weather was calm, with no significant cloud cover, and sufficient sunlight. The UAV camera parameters were set as follows: flight altitude of 100 meters and exposure time of 10 ms.
2.3 Spectral Preprocessing
2.3.1 Spectral Smoothing
Due to differences between spectral bands collected by the spectrometer, the data acquisition process can be influenced by spectral information unrelated to the sample, resulting in unsmooth spectral curves, commonly known as the "spike" phenomenon. In the data processing phase, to obtain "stable" spectral curves and reduce "noise" in the sample spectra, it is necessary to perform spectral denoising on the raw spectral reflectance data. Common spectral denoising methods include convolution smoothing, moving weighted average, Gaussian filtering, and median filtering. In this study, convolution smoothing was employed, with data processed using appropriate software.
3、UAV-Based Hyperspectral SPAD Inversion Study for Chili Peppers
3.1 Canopy Spectral Characteristics Analysis
As shown in Figure 3-1, the overall trend of UAV spectral reflectance indicates that in the shortwave region of visible light, the spectral reflectance of the leaves is generally low, featuring one peak and two troughs. In the longwave region of visible light, the leaf reflectance increases sharply and then stabilizes in the longwave and near-infrared regions. For SPAD values ranging from 30 to 70, there is no significant difference in spectral reflectance, while reflectance values corresponding to SPAD values greater than 70 are significantly lower than those for other SPAD values. Within the visible spectrum, there is no clear relationship between SPAD values and spectral reflectance; however, when the wavelength exceeds 730 nm, the trend shows that the higher the chlorophyll content, the lower the reflectance. The relationship between UAV and near-ground spectra and SPAD values can be described as an inverse correlation: as SPAD values increase, the corresponding reflectance decreases.
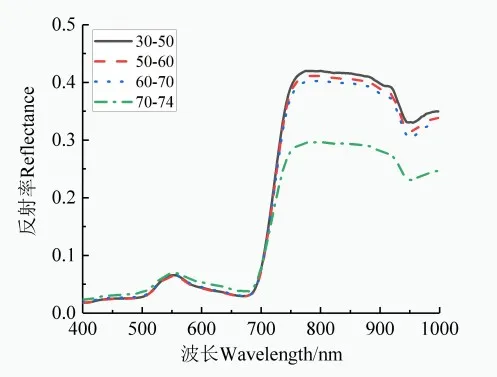
Figure 3-1 Spectral Reflectance Corresponding to Different SPAD Values (UAV)
Figure 3-2(a) presents the statistical chlorophyll content values for all leaf samples, while Figure 3-2(b) divides these samples into modeling and validation sets. In the chlorophyll statistics, the minimum, maximum, mean, and standard deviation are marked. The range of chlorophyll content in the training set samples is between 32.9 and 73.9, while in the prediction set, it is between 55.8 and 66.4. The average chlorophyll content in the training set is 59.7, with a standard deviation of 8.1, whereas the prediction set has an average chlorophyll content of 61.2 and a standard deviation of 3.2. The validation set’s average chlorophyll content is slightly higher than that of the modeling set, and its distribution range is narrower.
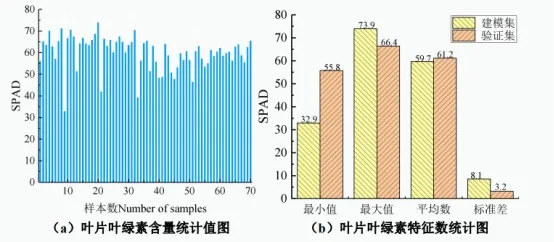
Figure 3-2 Chlorophyll Content Statistics for Sample Leaves
3.2 Data Preprocessing
After obtaining the raw inertial navigation data from the UAV-mounted spectrometer, the data needs to be processed through several steps, as shown in Figure 3-3. These steps include flight path segmentation, geometric correction, radiometric correction, geographic registration, image stitching, and radiometric calibration to derive the surface reflectance data from the cube data.
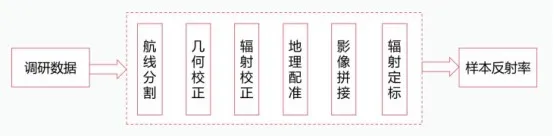
Figure 3-3 UAV Hyperspectral Data Preprocessing Steps
The spectral reflectance is then resampled, and the processed UAV hyperspectral range is 396 nm to 998 nm. To enhance the correlation between spectral reflectance and chlorophyll content and to mitigate the influence of surrounding noise and soil reflectance on the chili pepper spectrum, further processing is applied.
3.3 Correlation Analysis
3.3.1 Correlation Analysis Between Raw Spectra and SPAD Values
Using software, the correlation coefficients between the hyperspectral data of chili pepper leaves and SPAD values were calculated and plotted. The correlation between leaf chlorophyll content and the raw spectral reflectance is shown in Figure 3-4.
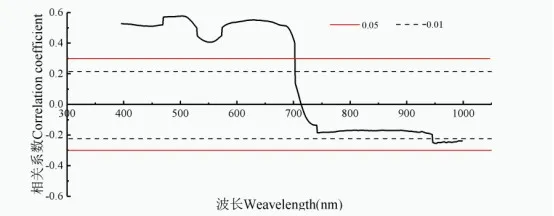
Figure 3-4 Correlation Coefficient Between Raw Spectra and SPAD Values
As shown in Figure 3-4, there is a strong correlation between the spectral reflectance of chili pepper leaves and chlorophyll content within the visible light range, particularly in the green light band (480–510 nm) and the red light band (587–702 nm). In contrast, the near-infrared band (780–1000 nm) shows almost no correlation. The 350–709 nm band shows a highly significant positive correlation (at the 0.01 significance level), with the strongest positive correlation at 504 nm, where the correlation coefficient is 0.58.
3.3.2 Correlation Analysis Between Reciprocal Logarithmic Spectra and SPAD Values
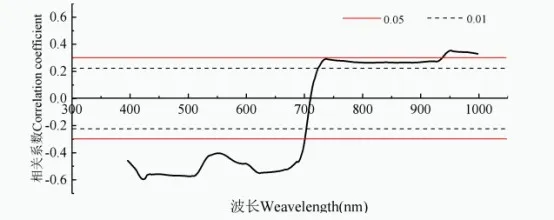
Figure 3-5 Correlation Coefficient Between Reciprocal Logarithmic Spectra and SPAD Values
As seen in Figure 3-5, the reciprocal logarithmic spectra exhibit a highly significant negative correlation (at the 0.01 significance level) in the 350–701 nm range, with the strongest correlation occurring at 423 nm, where the correlation coefficient is -0.60.
3.3.3 Correlation Analysis Between Multiplicative Scatter Correction Spectra and SPAD Values
Figure 3-6 shows that there is a highly significant negative correlation in the 350–523 nm range, with the strongest negative correlation occurring at 515 nm, where the correlation coefficient is -0.52. In the 540–732 nm range, a positive correlation is observed, with the strongest positive correlation occurring at 701 nm, where the correlation coefficient is 0.65.
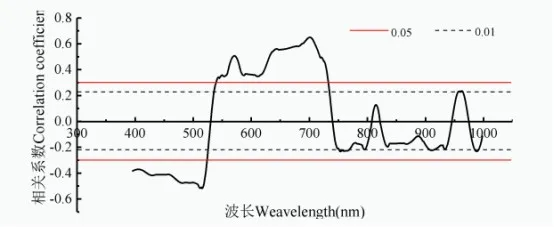
Figure 3-6 Correlation Coefficient Between Multiplicative Scatter Correction Spectra and SPAD Values
3.3.3 Correlation Analysis Between Continuum Removed Spectra and SPAD Values
The correlation between leaf chlorophyll content and continuum removed spectra is shown in Figure 3-7. As depicted in Figure 3-7, there is a highly significant positive correlation in the 400–724 nm range and a highly significant negative correlation in the 812–827 nm range. The strongest correlation is observed at 691 nm, with a correlation coefficient of 0.601.
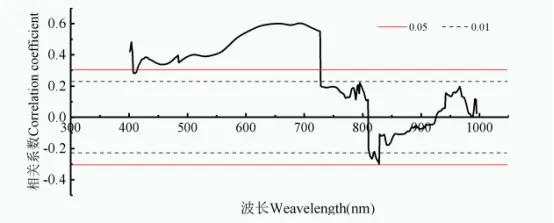
Figure 3-7 Correlation Coefficient Between Continuum Removed Spectra and SPAD Values
4、Conclusion
To achieve regional inversion of chili leaf chlorophyll content in the study area, this paper focused on chili peppers within the study region. Utilizing low-altitude hyperspectral remote sensing and near-ground hyperspectral technology, the study employed UAV hyperspectral data to invert chlorophyll content in chili peppers. Through the application of spectral analysis, mathematical statistics, and other technical methods, combined with field synchronous sampling data, a comprehensive analysis was conducted. The research identified characteristic bands and spectral vegetation indices related to chili physiological parameters, leading to the development of a highly generalizable and accurate SPAD inversion model. The study's findings provide a theoretical foundation and regional reference for the real-time monitoring and precise management of physiological parameters in mountainous chili cultivation.
Recommended Product:
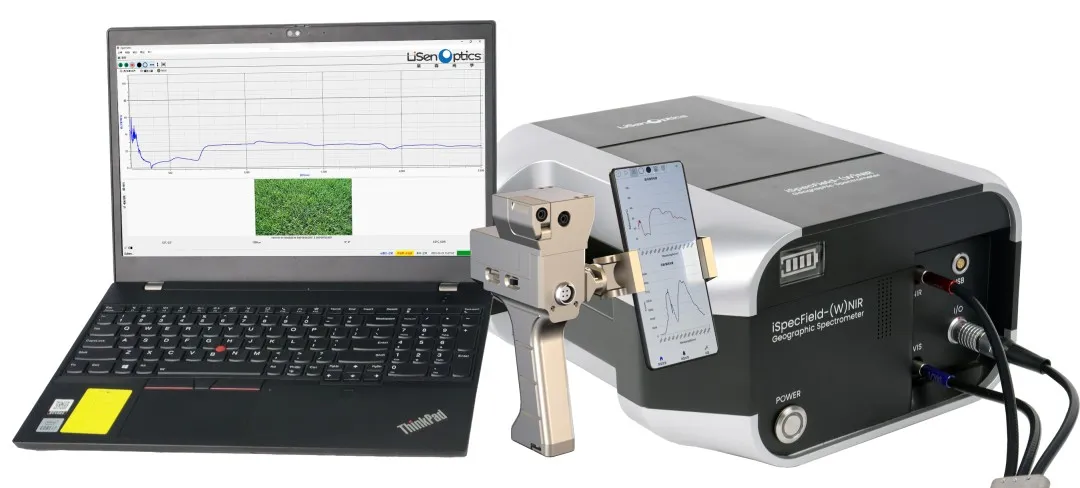
Field Spectrometer iSpecField-HH/NIR/WNIR
The Field Spectrometer is LiSen Optics' latest flagship product specifically designed for field remote sensing measurements, soil environments, and mineral geological exploration. It features a unique optical path design and noise calibration technology, allowing real-time automatic calibration of dark current. Utilizing a fixed holographic grating for one-time light splitting, it offers fast testing speeds with a minimum integration time as short as 20μs. The spectrometer is highly flexible and portable, providing rapid spectral testing and accurate spectral data. It is widely used in remote sensing measurements, crop monitoring, forestry research, oceanographic studies, and mineral exploration.
Abstract:This study focuses on chili peppers cultivated in Zunyi City, Guizhou Province. Field data collection included measuring SPAD values of chili pepper leaves during the peak fruiting stage and acquiring near-ground hyperspectral data as well as low-altitude UAV hyperspectral data. By extracting the spectral reflectance of chili pepper leaves from the hyperspectral data, preprocessing the data, and performing correlation analysis, a vegetation index highly correlated with the chlorophyll content of chili pepper leaves was developed.
Estimating Chlorophyll Content in Chili Pepper Leaves Based on Hyperspectral Remote Sensing Data
1、Introduction
The growth condition of chili peppers directly impacts their quality and economic value, making real-time monitoring of their growth essential. This monitoring is a prerequisite for ensuring the scientific cultivation of chili peppers. Chlorophyll, as the primary substance involved in photosynthesis, plays a critical role in this process, and its content can be used as an important indicator of plant health.
UAV-based hyperspectral remote sensing and near-ground hyperspectral technologies offer unique advantages in monitoring crop growth, classification, and other related fields. These technologies are fast, efficient, convenient, and capable of covering large areas, allowing for continuous and dynamic vegetation monitoring. They hold significant promise in research involving the rapid acquisition of large volumes of phenotypic data. Researchers have applied hyperspectral technology to retrieve vegetation parameters, enabling rapid, non-destructive monitoring of vegetation.
In this study, chili peppers were chosen as the research subject, and field experiments were conducted based on different chili varieties. Ground-based hyperspectral data, UAV hyperspectral data, and leaf SPAD values were measured. By leveraging the spectral characteristics of these two platforms, optimized spectral parameters were developed to reveal the impact and underlying relationships of different datasets on chlorophyll content estimation. A SPAD regression model based on machine learning algorithms was then established, leading to the development of a chlorophyll content estimation model tailored for chili pepper leaves in this study area. The findings have scientific significance and practical value for the scientific cultivation of chili peppers in the Guizhou region.
2、Experimental Design and Analysis Methods
2.1 Typical Ground Object Spectral Characteristics
The study area is located at the Guizhou Academy of Agricultural Sciences Chili Pepper Research Institute's Guanzhuang Demonstration Base in Xinpu New District, Zunyi City, Guizhou Province (E104°18′20″, N25°19′44″, as shown in Figure 2-1). Zunyi City, known for its diverse chili pepper varieties and high nutritional value, has been honored with the title of "World Chili Capital" by the World Chili Alliance.
Zunyi is situated in northern Guizhou Province, on the northeastern edge of the Yunnan-Guizhou Plateau, approximately 140 kilometers south of the provincial capital, Guiyang. Covering a total area of 30,762 square kilometers, the study area is characterized by a mid-subtropical humid monsoon climate of the plateau. The region experiences distinct seasons, with hot and rainy periods coinciding, and has a long frost-free period of about 250 to 350 days. The annual average temperature is 15.1°C, with sunshine duration ranging from 23% to 29%, ensuring ample sunlight. The area also receives abundant rainfall, with an annual average precipitation ranging between 900mm and 1200mm, varying from 800mm to 1600mm. These conditions provide a natural advantage for chili pepper cultivation.
Figure 2-1 Location Map of the Study Area
2.2 Hyperspectral Data Acquisition
2.2.1 Ground-Based Non-Imaging Spectral Data Acquisition
The spectral measurements were conducted on chili pepper leaves during the peak fruiting stage using a portable field spectrometer. Measurements were taken under favorable weather conditions, between 10:00 AM and 3:00 PM. To avoid light pollution, the personnel conducting the measurements wore dark-colored clothing.
The measurement process was as follows: The spectrometer probe was oriented downward and positioned approximately 15 to 30 cm above the plant canopy. Every five plants, a standard white reference panel calibration was performed. For each plant, five measurements were taken, and the average value was used as the final reflectance. The spectral range measured in this study was between 350 nm and 2500 nm, covering a total of 2151 bands. Due to the influence of water absorption bands at 1400 nm and 1900 nm, and given that previous studies have shown chlorophyll response bands to be within the visible and near-infrared ranges, this study focused on the spectral range from 350 nm to 1300 nm for chlorophyll analysis using the hyperspectral data.
2.2.2 Low-Altitude Imaging Hyperspectral Data Acquisition
A hyperspectral imaging system was used to collect image data of the study area on the morning of September 8, 2021, between 11:00 AM and 12:00 PM. The weather was calm, with no significant cloud cover, and sufficient sunlight. The UAV camera parameters were set as follows: flight altitude of 100 meters and exposure time of 10 ms.
2.3 Spectral Preprocessing
2.3.1 Spectral Smoothing
Due to differences between spectral bands collected by the spectrometer, the data acquisition process can be influenced by spectral information unrelated to the sample, resulting in unsmooth spectral curves, commonly known as the "spike" phenomenon. In the data processing phase, to obtain "stable" spectral curves and reduce "noise" in the sample spectra, it is necessary to perform spectral denoising on the raw spectral reflectance data. Common spectral denoising methods include convolution smoothing, moving weighted average, Gaussian filtering, and median filtering. In this study, convolution smoothing was employed, with data processed using appropriate software.
3、UAV-Based Hyperspectral SPAD Inversion Study for Chili Peppers
3.1 Canopy Spectral Characteristics Analysis
As shown in Figure 3-1, the overall trend of UAV spectral reflectance indicates that in the shortwave region of visible light, the spectral reflectance of the leaves is generally low, featuring one peak and two troughs. In the longwave region of visible light, the leaf reflectance increases sharply and then stabilizes in the longwave and near-infrared regions. For SPAD values ranging from 30 to 70, there is no significant difference in spectral reflectance, while reflectance values corresponding to SPAD values greater than 70 are significantly lower than those for other SPAD values. Within the visible spectrum, there is no clear relationship between SPAD values and spectral reflectance; however, when the wavelength exceeds 730 nm, the trend shows that the higher the chlorophyll content, the lower the reflectance. The relationship between UAV and near-ground spectra and SPAD values can be described as an inverse correlation: as SPAD values increase, the corresponding reflectance decreases.
Figure 3-1 Spectral Reflectance Corresponding to Different SPAD Values (UAV)
Figure 3-2(a) presents the statistical chlorophyll content values for all leaf samples, while Figure 3-2(b) divides these samples into modeling and validation sets. In the chlorophyll statistics, the minimum, maximum, mean, and standard deviation are marked. The range of chlorophyll content in the training set samples is between 32.9 and 73.9, while in the prediction set, it is between 55.8 and 66.4. The average chlorophyll content in the training set is 59.7, with a standard deviation of 8.1, whereas the prediction set has an average chlorophyll content of 61.2 and a standard deviation of 3.2. The validation set’s average chlorophyll content is slightly higher than that of the modeling set, and its distribution range is narrower.
Figure 3-2 Chlorophyll Content Statistics for Sample Leaves
3.2 Data Preprocessing
After obtaining the raw inertial navigation data from the UAV-mounted spectrometer, the data needs to be processed through several steps, as shown in Figure 3-3. These steps include flight path segmentation, geometric correction, radiometric correction, geographic registration, image stitching, and radiometric calibration to derive the surface reflectance data from the cube data.
Figure 3-3 UAV Hyperspectral Data Preprocessing Steps
The spectral reflectance is then resampled, and the processed UAV hyperspectral range is 396 nm to 998 nm. To enhance the correlation between spectral reflectance and chlorophyll content and to mitigate the influence of surrounding noise and soil reflectance on the chili pepper spectrum, further processing is applied.
3.3 Correlation Analysis
3.3.1 Correlation Analysis Between Raw Spectra and SPAD Values
Using software, the correlation coefficients between the hyperspectral data of chili pepper leaves and SPAD values were calculated and plotted. The correlation between leaf chlorophyll content and the raw spectral reflectance is shown in Figure 3-4.
Figure 3-4 Correlation Coefficient Between Raw Spectra and SPAD Values
As shown in Figure 3-4, there is a strong correlation between the spectral reflectance of chili pepper leaves and chlorophyll content within the visible light range, particularly in the green light band (480–510 nm) and the red light band (587–702 nm). In contrast, the near-infrared band (780–1000 nm) shows almost no correlation. The 350–709 nm band shows a highly significant positive correlation (at the 0.01 significance level), with the strongest positive correlation at 504 nm, where the correlation coefficient is 0.58.
3.3.2 Correlation Analysis Between Reciprocal Logarithmic Spectra and SPAD Values
Figure 3-5 Correlation Coefficient Between Reciprocal Logarithmic Spectra and SPAD Values
As seen in Figure 3-5, the reciprocal logarithmic spectra exhibit a highly significant negative correlation (at the 0.01 significance level) in the 350–701 nm range, with the strongest correlation occurring at 423 nm, where the correlation coefficient is -0.60.
3.3.3 Correlation Analysis Between Multiplicative Scatter Correction Spectra and SPAD Values
Figure 3-6 shows that there is a highly significant negative correlation in the 350–523 nm range, with the strongest negative correlation occurring at 515 nm, where the correlation coefficient is -0.52. In the 540–732 nm range, a positive correlation is observed, with the strongest positive correlation occurring at 701 nm, where the correlation coefficient is 0.65.
Figure 3-6 Correlation Coefficient Between Multiplicative Scatter Correction Spectra and SPAD Values
3.3.3 Correlation Analysis Between Continuum Removed Spectra and SPAD Values
The correlation between leaf chlorophyll content and continuum removed spectra is shown in Figure 3-7. As depicted in Figure 3-7, there is a highly significant positive correlation in the 400–724 nm range and a highly significant negative correlation in the 812–827 nm range. The strongest correlation is observed at 691 nm, with a correlation coefficient of 0.601.
Figure 3-7 Correlation Coefficient Between Continuum Removed Spectra and SPAD Values
4、Conclusion
To achieve regional inversion of chili leaf chlorophyll content in the study area, this paper focused on chili peppers within the study region. Utilizing low-altitude hyperspectral remote sensing and near-ground hyperspectral technology, the study employed UAV hyperspectral data to invert chlorophyll content in chili peppers. Through the application of spectral analysis, mathematical statistics, and other technical methods, combined with field synchronous sampling data, a comprehensive analysis was conducted. The research identified characteristic bands and spectral vegetation indices related to chili physiological parameters, leading to the development of a highly generalizable and accurate SPAD inversion model. The study's findings provide a theoretical foundation and regional reference for the real-time monitoring and precise management of physiological parameters in mountainous chili cultivation.
Recommended Product:
Field Spectrometer iSpecField-HH/NIR/WNIR
The Field Spectrometer is LiSen Optics' latest flagship product specifically designed for field remote sensing measurements, soil environments, and mineral geological exploration. It features a unique optical path design and noise calibration technology, allowing real-time automatic calibration of dark current. Utilizing a fixed holographic grating for one-time light splitting, it offers fast testing speeds with a minimum integration time as short as 20μs. The spectrometer is highly flexible and portable, providing rapid spectral testing and accurate spectral data. It is widely used in remote sensing measurements, crop monitoring, forestry research, oceanographic studies, and mineral exploration.
Next: No data
PRODUCTS
Copyright © 2025 Lisen Optics (Shenzhen) Co., Ltd.