Get Your Free Spectral Analysis Solution.
Tell us about your requirements. Our experts will contact you within 24 hours.
The Raman spectrometer series from LiSen Optics incorporates a miniaturized confocal design that suppresses fluorescence, boasting a compact size and lightweight structure. These spectrometers can operate independently or be integrated into various standardized systems including handheld, portable, and boxed Raman spectrometer setups. They are characterized by high sensitivity, high signal-to-noise ratio, and a wide spectral range, making them ideally suited for research needs in sectors such as inorganic/organic materials, biosciences, chemistry/chemical engineering, pharmaceutical analysis, food safety, forensic identification, and environmental pollution detection.
The Raman spectrometer series from LiSen Optics incorporates a miniaturized confocal design that suppresses fluorescence, boasting a compact size and lightweight structure. These spectrometers can operate independently or be integrated into various standardized systems including handheld, portable, and boxed Raman spectrometer setups. They are characterized by high sensitivity, high signal-to-noise ratio, and a wide spectral range, making them ideally suited for research needs in sectors such as inorganic/organic materials, biosciences, chemistry/chemical engineering, pharmaceutical analysis, food safety, forensic identification, and environmental pollution detection.
 |
 |
 |
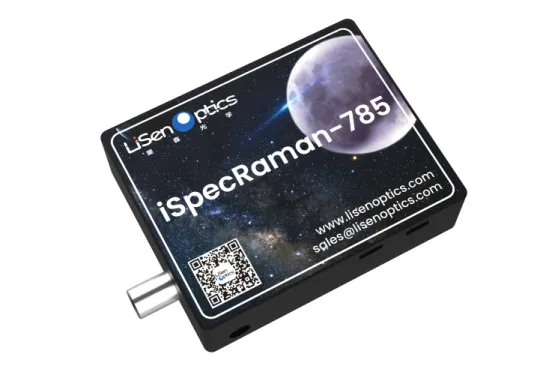
| iSpecRaman-HH | iSpecRaman-785 |
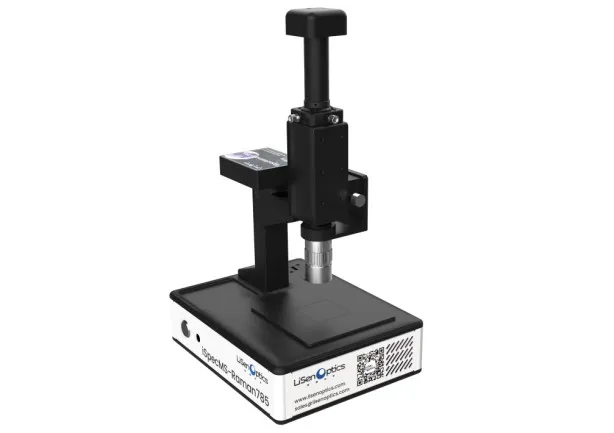
iSpecMS-Raman785 |
Main Technical Indicators
Raman spectroscopy is based on the scattering of light by molecules, associated with changes in the vibrational and rotational energy levels resulting from changes in molecular polarizability. It occurs due to symmetric vibrations of bonds with symmetric charge distributions, such as -C=C-, -N=N-, and -S-S-, where the dipole moment remains unchanged during vibration. By stimulating molecular motion with light and interpreting this interaction, chemical analysis of samples is possible. Raman spectroscopy is frequently used to investigate the symmetric vibrations of non-polar groups and backbones.
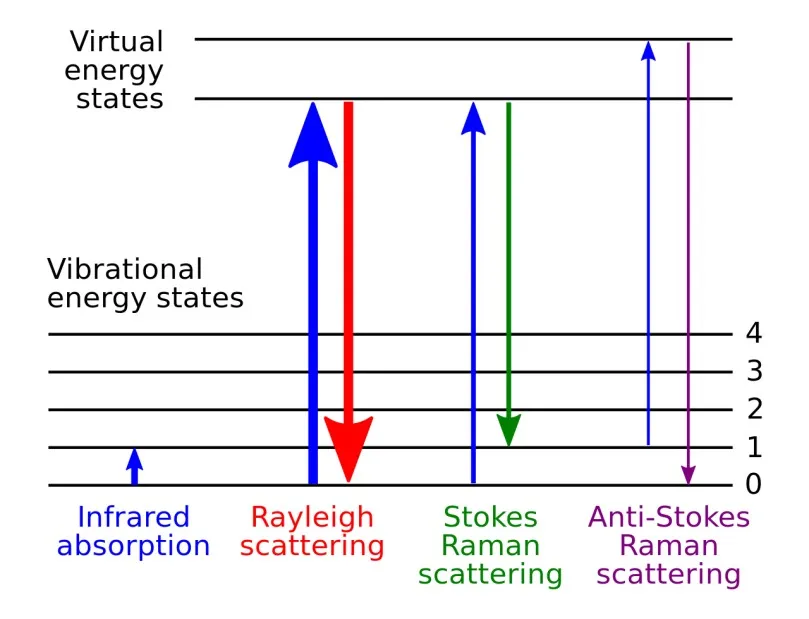
An energy level diagram visually displays various energy levels corresponding to Raman signals, with line thickness roughly indicative of signal magnitude.
The Raman effect happens when light interacts with electron clouds and molecular bonds, leading to spontaneous Raman scattering. This phenomenon excites molecules from the ground state to a virtual energy state. When these excited molecules emit a photon and return to a different state from the ground state—either rotational or vibrational—the energy difference between these states results in the emitted photon having a frequency different from that of the excitation light.
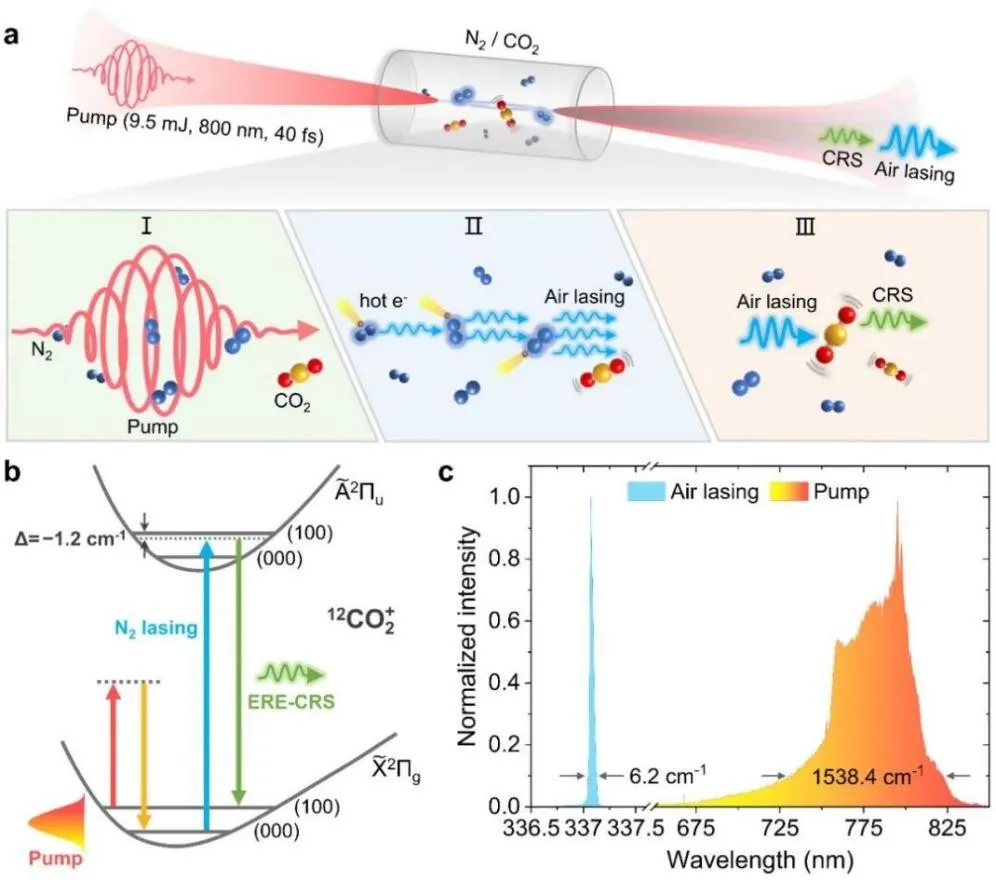
Basic Principles of Single-Beam Electron Resonance Enhanced Coherent Raman Scattering
|
|
|
| iSpecRaman-HH | iSpecRaman-785 |
iSpecMS-Raman785 |
Main Technical Indicators
Raman spectroscopy is based on the scattering of light by molecules, associated with changes in the vibrational and rotational energy levels resulting from changes in molecular polarizability. It occurs due to symmetric vibrations of bonds with symmetric charge distributions, such as -C=C-, -N=N-, and -S-S-, where the dipole moment remains unchanged during vibration. By stimulating molecular motion with light and interpreting this interaction, chemical analysis of samples is possible. Raman spectroscopy is frequently used to investigate the symmetric vibrations of non-polar groups and backbones.
An energy level diagram visually displays various energy levels corresponding to Raman signals, with line thickness roughly indicative of signal magnitude.
The Raman effect happens when light interacts with electron clouds and molecular bonds, leading to spontaneous Raman scattering. This phenomenon excites molecules from the ground state to a virtual energy state. When these excited molecules emit a photon and return to a different state from the ground state—either rotational or vibrational—the energy difference between these states results in the emitted photon having a frequency different from that of the excitation light.
Basic Principles of Single-Beam Electron Resonance Enhanced Coherent Raman Scattering
Raman Measurement Solutions
To obtain a Raman spectrum, simply focus a laser on the sample. The sample under the excitation laser must not produce fluorescence. If fluorescence occurs, it will mask the majority of the Raman effect, as the fluorescence signal is significantly stronger than the Raman signal. After the laser irradiates the sample, the scattered light passes through a filter to remove any light from the excitation laser. This light is then directed onto a grating, which, like a prism, disperses the inelastically scattered light according to wavelength. Finally, these light rays are directed to a CCD sensor, which creates a spectrum based on the intensity.

Raman Measurement Setup Diagram
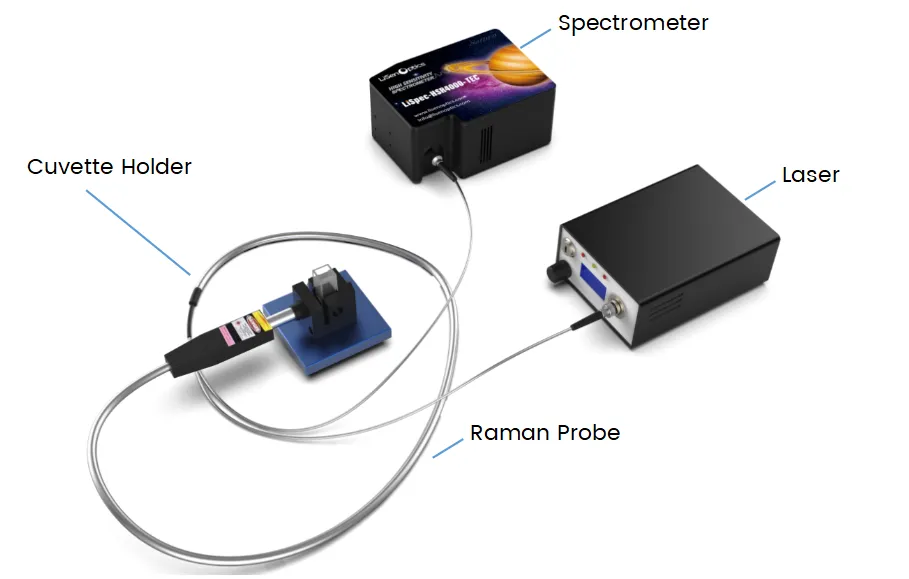
Raman Connection Diagram
Raman spectroscopy is valuable for both qualitative and quantitative analyses. The Raman spectrum, featuring peak positions and relative intensities, provides a unique chemical fingerprint that can identify a substance and distinguish it from others. Practical testing of Raman spectra can be complex, especially when peak attribution for unknown substances is challenging. Utilizing a Raman spectroscopy database for matching can expedite the identification process of unknown substances.
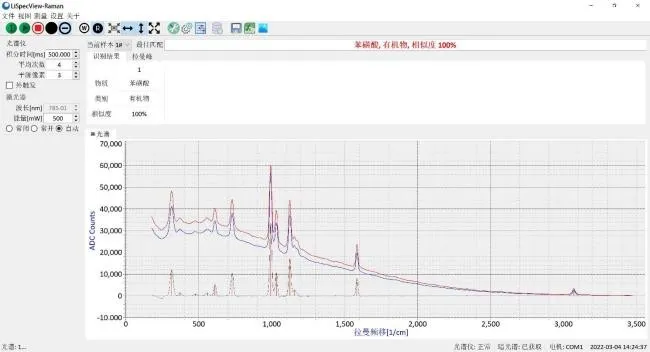
Software Interface
Raman Measurement Solutions
To obtain a Raman spectrum, simply focus a laser on the sample. The sample under the excitation laser must not produce fluorescence. If fluorescence occurs, it will mask the majority of the Raman effect, as the fluorescence signal is significantly stronger than the Raman signal. After the laser irradiates the sample, the scattered light passes through a filter to remove any light from the excitation laser. This light is then directed onto a grating, which, like a prism, disperses the inelastically scattered light according to wavelength. Finally, these light rays are directed to a CCD sensor, which creates a spectrum based on the intensity.
Raman Measurement Setup Diagram
Raman Connection Diagram
Raman spectroscopy is valuable for both qualitative and quantitative analyses. The Raman spectrum, featuring peak positions and relative intensities, provides a unique chemical fingerprint that can identify a substance and distinguish it from others. Practical testing of Raman spectra can be complex, especially when peak attribution for unknown substances is challenging. Utilizing a Raman spectroscopy database for matching can expedite the identification process of unknown substances.
Software Interface
Technical Advantages
● High Spatial Resolution and Spectral Resolution
● Excellent Stability and High Coupling Efficiency
Main Technical Indicators
|
Model |
iSpecRaman-HH |
iSpecRaman-785 |
iSpecMS-Raman785 |
|
Pic. |
|
|
|
|
Spectral Range |
200-3100 nm |
200-3200 nm |
200-3200 nm |
|
Optical Resolution (FWHM) |
7 cm^-1 |
7 cm^-1 |
7 cm^-1 |
|
Wavelength Accuracy |
≤±0.5 nm |
≤±0.5 nm |
≤±0.5 nm |
|
Stray Light |
<1% |
<1% |
<1% |
|
Detector |
Linear 2048-pixel CMOS |
Linear 2048-pixel CMOS |
Linear 2048-pixel CMOS |
|
Signal to Noise Ratio |
350:01:00 |
350:01:00 |
350:01:00 |
|
Dynamic Range |
3300:01:00 |
3300:01:00 |
3300:01:00 |
|
Dark Noise (RMS) |
30 counts |
30 counts |
30 counts |
|
AD Conversion |
16-bit, 15MHz |
16-bit, 15MHz |
16-bit, 15MHz |
|
Integration Time |
1 ms - 65 s |
1 ms - 65 s |
1 ms - 65 s |
|
Excitation Wavelength |
785±0.5 nm |
785±0.5 nm |
785±0.5 nm |
|
Power Range |
0-500 mW |
5-500 mW |
5-500 mW |
|
Communication Interface |
Type-C |
USB 2.0 |
USB 2.0 |
|
I/O Interface |
Type-C |
USB 2.0 |
USB 2.0 |
|
Display |
5.72-inch industrial touch screen, 16MP camera |
None |
None |
|
Positioning Accuracy |
None |
None |
50 μm |
|
Objective |
None |
None |
20X achromatic long-focus objective (5X, 10X, 50X optional) |
|
Scanning Range |
None |
None |
50x50 mm |
|
Power Supply |
2A/5V DC |
2A/5V DC |
2A/5V DC |
|
Operating Temperature |
0-45°C |
0-45°C |
0-45°C |
|
Dimensions/Weight |
182 x 89 x 36 mm / 500 g |
100 x 80 x 26 mm / 280 g |
200 x 350 x 295 mm / 6 kg |
Application
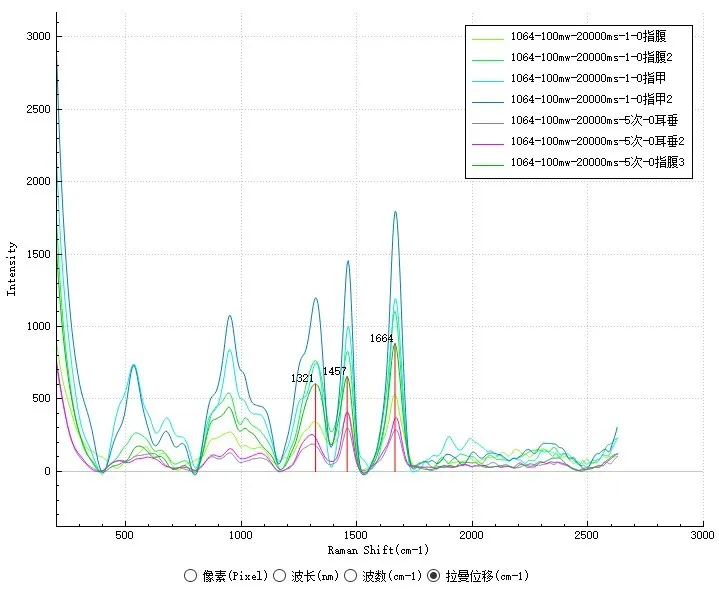
Raman spectroscopy includes certain "bands" or signals that are unique to specific functional groups and substances. This technique offers a rapid, non-destructive means to gather extensive information. It provides not only insights into the chemical composition of materials but also detailed data about molecular vibration frequencies and intensities, crystallinity, polymorphism, or changes in pressure and temperature. This is fundamental for understanding and analyzing the structure and function of materials.
Currently, Raman spectroscopy is applied in a variety of fields including semiconductor materials, polymers, carbon materials, geology/mineralogy/gemology, life sciences, medicine, chemistry, environmental science, physics, archaeology, and forensic science. In forensics, it is used for the detection of illegal drugs, distinguishing various pigments, dyes, paints, fibers, etc. Additionally, it finds applications in the study of explosives, ink analysis, bullet residue, and geological fragments.
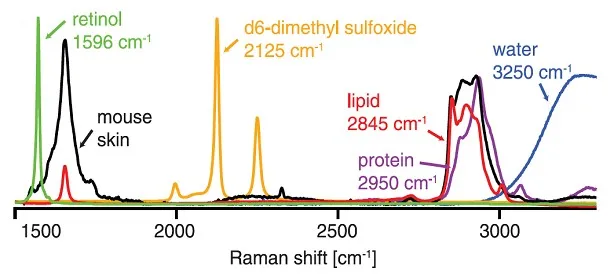
Raman Spectroscopy of Common Biological Components and Molecules
In the field of environmental science, Raman spectroscopy can be used to monitor and analyze pollutants in water bodies, soil, and the atmosphere, providing a scientific basis for environmental protection and management. Additionally, Raman spectroscopy also has promising applications in archaeology, geology, and other areas.
 |
 |
|
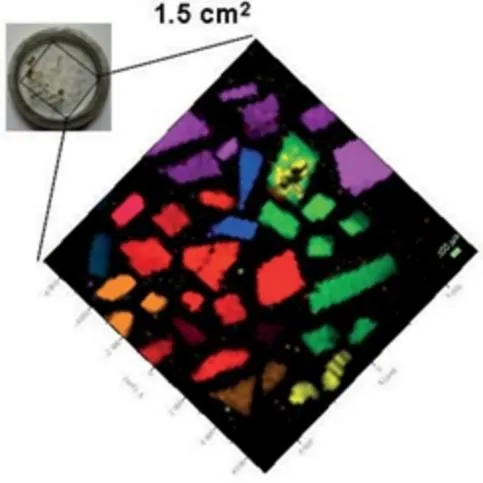
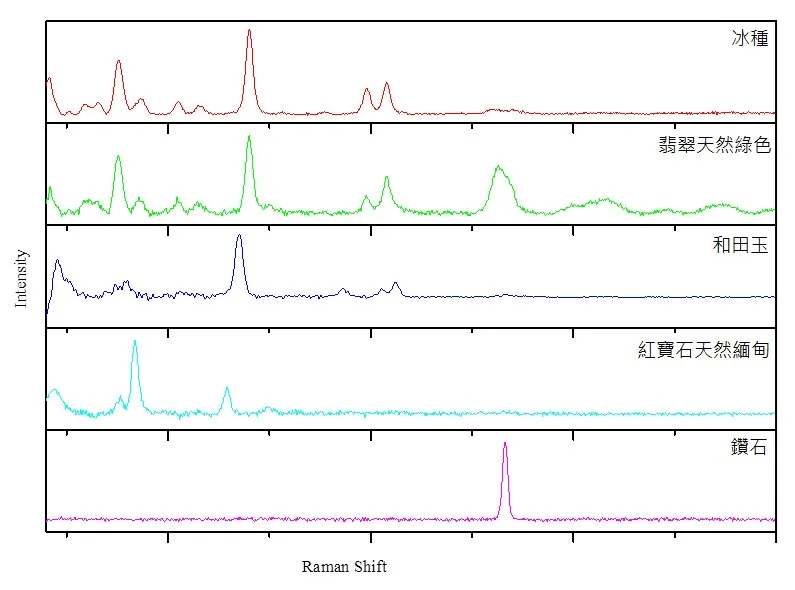
Minerals Analysis |
Gem Samples Raman Spectrum |
In the medical diagnostic field, Raman spectroscopy can assist in diagnosing diseases such as tumors, inflammations, and infections, offering new methods for early disease detection and treatment.
 |
 |
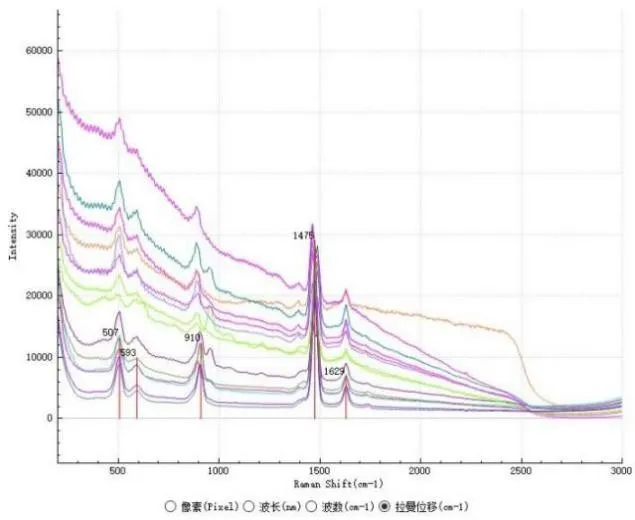
For example, the analysis might show the composition of different types of kidney stones:
14 cases (top left) show calcium oxalate stones;
3 cases (top right) are calcium phosphate stones;
3 cases (bottom) are uric acid stones.
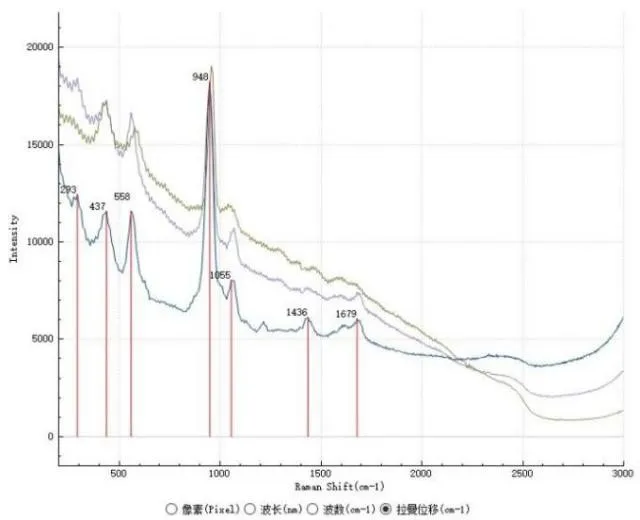
Skin Tissue Raman Spectrum
Technical Advantages
● High Spatial Resolution and Spectral Resolution
● Excellent Stability and High Coupling Efficiency
Main Technical Indicators
|
Model |
iSpecRaman-HH |
iSpecRaman-785 |
iSpecMS-Raman785 |
|
Pic. |
|
|
|
|
Spectral Range |
200-3100 nm |
200-3200 nm |
200-3200 nm |
|
Optical Resolution (FWHM) |
7 cm^-1 |
7 cm^-1 |
7 cm^-1 |
|
Wavelength Accuracy |
≤±0.5 nm |
≤±0.5 nm |
≤±0.5 nm |
|
Stray Light |
<1% |
<1% |
<1% |
|
Detector |
Linear 2048-pixel CMOS |
Linear 2048-pixel CMOS |
Linear 2048-pixel CMOS |
|
Signal to Noise Ratio |
350:01:00 |
350:01:00 |
350:01:00 |
|
Dynamic Range |
3300:01:00 |
3300:01:00 |
3300:01:00 |
|
Dark Noise (RMS) |
30 counts |
30 counts |
30 counts |
|
AD Conversion |
16-bit, 15MHz |
16-bit, 15MHz |
16-bit, 15MHz |
|
Integration Time |
1 ms - 65 s |
1 ms - 65 s |
1 ms - 65 s |
|
Excitation Wavelength |
785±0.5 nm |
785±0.5 nm |
785±0.5 nm |
|
Power Range |
0-500 mW |
5-500 mW |
5-500 mW |
|
Communication Interface |
Type-C |
USB 2.0 |
USB 2.0 |
|
I/O Interface |
Type-C |
USB 2.0 |
USB 2.0 |
|
Display |
5.72-inch industrial touch screen, 16MP camera |
None |
None |
|
Positioning Accuracy |
None |
None |
50 μm |
|
Objective |
None |
None |
20X achromatic long-focus objective (5X, 10X, 50X optional) |
|
Scanning Range |
None |
None |
50x50 mm |
|
Power Supply |
2A/5V DC |
2A/5V DC |
2A/5V DC |
|
Operating Temperature |
0-45°C |
0-45°C |
0-45°C |
|
Dimensions/Weight |
182 x 89 x 36 mm / 500 g |
100 x 80 x 26 mm / 280 g |
200 x 350 x 295 mm / 6 kg |
Application
Raman spectroscopy includes certain "bands" or signals that are unique to specific functional groups and substances. This technique offers a rapid, non-destructive means to gather extensive information. It provides not only insights into the chemical composition of materials but also detailed data about molecular vibration frequencies and intensities, crystallinity, polymorphism, or changes in pressure and temperature. This is fundamental for understanding and analyzing the structure and function of materials.
Currently, Raman spectroscopy is applied in a variety of fields including semiconductor materials, polymers, carbon materials, geology/mineralogy/gemology, life sciences, medicine, chemistry, environmental science, physics, archaeology, and forensic science. In forensics, it is used for the detection of illegal drugs, distinguishing various pigments, dyes, paints, fibers, etc. Additionally, it finds applications in the study of explosives, ink analysis, bullet residue, and geological fragments.
Raman Spectroscopy of Common Biological Components and Molecules
In the field of environmental science, Raman spectroscopy can be used to monitor and analyze pollutants in water bodies, soil, and the atmosphere, providing a scientific basis for environmental protection and management. Additionally, Raman spectroscopy also has promising applications in archaeology, geology, and other areas.
|
|
|
Minerals Analysis |
Gem Samples Raman Spectrum |
In the medical diagnostic field, Raman spectroscopy can assist in diagnosing diseases such as tumors, inflammations, and infections, offering new methods for early disease detection and treatment.
|
|
For example, the analysis might show the composition of different types of kidney stones:
14 cases (top left) show calcium oxalate stones;
3 cases (top right) are calcium phosphate stones;
3 cases (bottom) are uric acid stones.
Skin Tissue Raman Spectrum
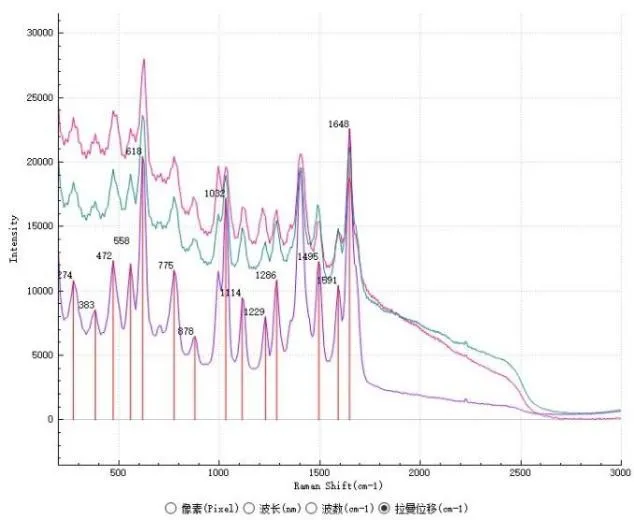
In the field of chemistry, chemical bonds and symmetric molecules have specific vibrational spectral information, making them crucial for molecular identification. For instance, the vibrational frequencies of SiO, Si2O2, and Si3O3 can be identified and are fundamental to studies in infrared spectroscopy and Raman spectroscopic coordination analysis.
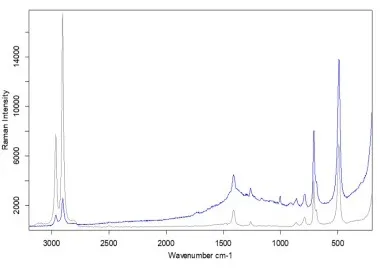
Raman Spectrum of Dimethyl Silicone Sample (Blue) Compared to Spectral Library
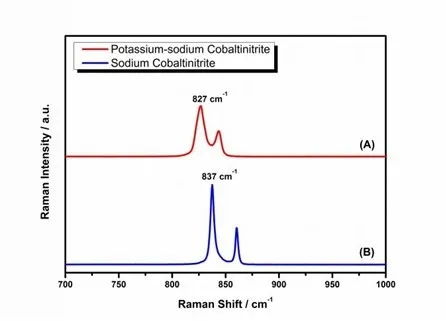
Raman Spectra of Sodium Cobalt Nitrite Solution (Blue) & Sodium Potassium Cobalt Nitrite (Red)
In the field of chemistry, chemical bonds and symmetric molecules have specific vibrational spectral information, making them crucial for molecular identification. For instance, the vibrational frequencies of SiO, Si2O2, and Si3O3 can be identified and are fundamental to studies in infrared spectroscopy and Raman spectroscopic coordination analysis.
Raman Spectrum of Dimethyl Silicone Sample (Blue) Compared to Spectral Library
Raman Spectra of Sodium Cobalt Nitrite Solution (Blue) & Sodium Potassium Cobalt Nitrite (Red)
Get Your Free Spectral Analysis Solution.
Tell us about your requirements. Our experts will contact you within 24 hours.
Focus on spectral sensing and optoelectronic application systems