
Focus on spectral sensing and optoelectronic application systems
Hyperspectral Imaging System
Time:2025-01-14
Abstract:Detecting and identifying the latent period of early blight in pepper can provide timely guidance for disease control, allowing for the management of the disease before crop infection and preventing its spread. This has significant implications for crop growth management.
The Spectral Characteristic Discrimination Method for Early Blight Latent Period in Chili Peppers
Chili early blight is a common biological disaster that affects the safe growth of chili peppers. It is characterized by its sudden onset and high susceptibility, which can lead to significant economic losses. During the growth of chili peppers, scientifically monitoring and providing early warning for the disease’s latent infection period is a critical prerequisite for ensuring healthy crop growth. Traditional disease detection methods rely on visual observation of visible symptoms, but due to factors such as crop planting area and yield, coupled with the rapid spread of early blight, it is difficult to control the development of the disease. Therefore, detecting and identifying the latent period of early blight in chili peppers can provide timely guidance for disease prevention and control, helping to manage the disease before the crops become infected and preventing its spread, which is of great significance for crop growth management.
01 Experimental Content
Chili pepper leaves were selected as the research object. The infection status of early blight in excised chili pepper leaves was continuously and dynamically monitored using a hyperspectral imaging system, and corresponding hyperspectral images were obtained. The entire leaf surface was selected as the region of interest (ROI), and the average spectrum of the ROI was extracted. Average spectral curves for healthy and inoculated samples were obtained at different time points of data collection.
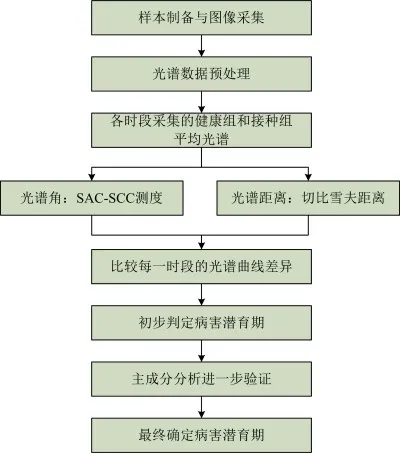
Figure 1: Hyperspectral Image Discrimination Flowchart for Crop Disease Incubation Period Based on Spectral Characteristics
02 Results
Following the general process of crop disease infection, hyperspectral images were continuously and dynamically collected to cover the entire disease incubation period. To comprehensively consider the spectral changes of the entire leaf before and after inoculation, the spectral reflectance of the whole leaf within the 400-1000 nm range was averaged across 256 bands, resulting in the average spectral curve for the entire leaf. This approach effectively reduces random errors on the leaf surface.
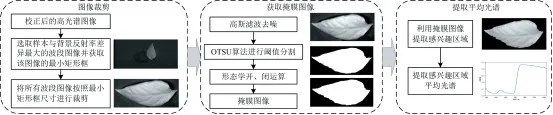
Figure 2: Interested Area Selection Process Flowchart in the Industrial Sector
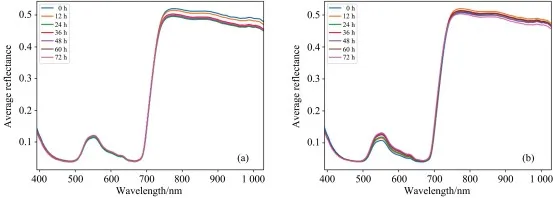
Figure 3: Evolution Trend of the Average Spectra of Healthy and Inoculated Samples Over Time
(a) Healthy Group (b) Inoculated Group
From Figure 3(a), it can be observed that over time, the spectra of healthy pepper leaves exhibit a clear separation in the 760–1000 nm range. The average spectral reflectance of the leaves gradually decreases, primarily due to slow cellular metabolism and water loss after ex vitro culture. In other wavelength ranges, the overall spectral curves of the healthy group are closely overlapping, indicating that during dynamic monitoring, the physiological state of the healthy group remains stable.
In Figure 3(b), the spectra of the inoculated group show significant differences in the 500–670 nm, 680–760 nm, and 760–1000 nm wavelength ranges. This indicates that the physiological activity of the inoculated group fluctuates over time, which also partly reflects the effectiveness of inoculation. Specifically, the spectral curves of inoculated leaves gradually separate in the 500–670 nm range over the collection period, and the average spectral reflectance increases. This is mainly due to the decrease in pigment content, such as chlorophyll and carotenoids, in the leaf cells due to pathogen infection, leading to reduced light absorption and increased reflectance. The 680–760 nm range, which is the boundary between visible and near-infrared light, corresponds to the red edge of green plants and is a key indicator of plant pigment status and health. In this range, the spectral reflectance increases most rapidly.
In general, the better the plant growth status, the red edge will show a red shift; conversely, it will shift towards the blue, or blue shift, indicating that with the passage of inoculation time, the red edge of the inoculated samples gradually shifts to the left, or blue shift. From Figure 3, it can be seen that compared with the average spectral curves of healthy plants, the average spectral curves of infected plants undergo varying degrees of change, suggesting the potential for using spectral characteristics to determine the earliest time point for identifying the latent period of crop diseases. However, simply analyzing the overall trend of spectral curve changes during the collection period does not directly indicate the earliest time for disease latent period identification. Appropriate measurement methods are required to deeply explore the differences between spectral curves.
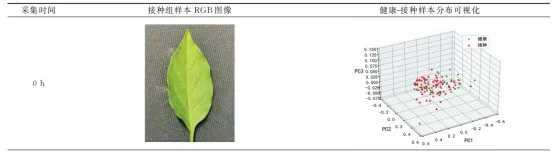
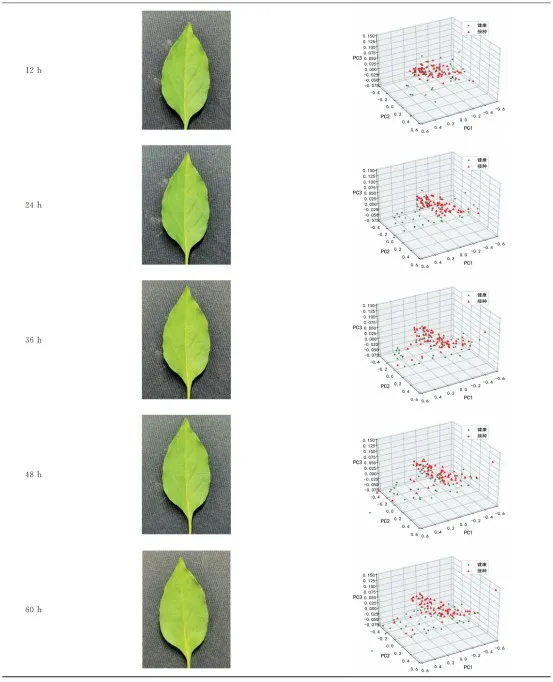
Table 1: Changes in RGB Image and Principal Component Distribution Visualization Images of Samples Over Collection Time
Recommended:
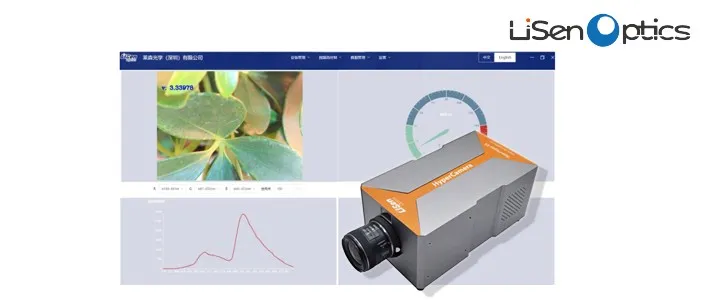
Hyperspectral Imaging System iSpecHyper-VS1000
The latest product specifically designed for fields such as police criminal investigation, forensic evidence identification, medical care, precision agriculture, and mineral geological exploration has several main advantages: compact size, high frame rate, high spectral resolution, and high image quality, offering excellent cost performance. It adopts the push-broom principle with transmission grating for hyperspectral imaging. The system integrates a high-performance data acquisition and analysis processing system, features high-speed USB 3.0 interface transmission, and a full-frame high imaging quality optical design. The objective lens interface is a standard C-Mount, allowing for the replacement of the objective lens based on user requirements.
Abstract:Detecting and identifying the latent period of early blight in pepper can provide timely guidance for disease control, allowing for the management of the disease before crop infection and preventing its spread. This has significant implications for crop growth management.
The Spectral Characteristic Discrimination Method for Early Blight Latent Period in Chili Peppers
Chili early blight is a common biological disaster that affects the safe growth of chili peppers. It is characterized by its sudden onset and high susceptibility, which can lead to significant economic losses. During the growth of chili peppers, scientifically monitoring and providing early warning for the disease’s latent infection period is a critical prerequisite for ensuring healthy crop growth. Traditional disease detection methods rely on visual observation of visible symptoms, but due to factors such as crop planting area and yield, coupled with the rapid spread of early blight, it is difficult to control the development of the disease. Therefore, detecting and identifying the latent period of early blight in chili peppers can provide timely guidance for disease prevention and control, helping to manage the disease before the crops become infected and preventing its spread, which is of great significance for crop growth management.
01 Experimental Content
Chili pepper leaves were selected as the research object. The infection status of early blight in excised chili pepper leaves was continuously and dynamically monitored using a hyperspectral imaging system, and corresponding hyperspectral images were obtained. The entire leaf surface was selected as the region of interest (ROI), and the average spectrum of the ROI was extracted. Average spectral curves for healthy and inoculated samples were obtained at different time points of data collection.
Figure 1: Hyperspectral Image Discrimination Flowchart for Crop Disease Incubation Period Based on Spectral Characteristics
02 Results
Following the general process of crop disease infection, hyperspectral images were continuously and dynamically collected to cover the entire disease incubation period. To comprehensively consider the spectral changes of the entire leaf before and after inoculation, the spectral reflectance of the whole leaf within the 400-1000 nm range was averaged across 256 bands, resulting in the average spectral curve for the entire leaf. This approach effectively reduces random errors on the leaf surface.
Figure 2: Interested Area Selection Process Flowchart in the Industrial Sector
Figure 3: Evolution Trend of the Average Spectra of Healthy and Inoculated Samples Over Time
(a) Healthy Group (b) Inoculated Group
From Figure 3(a), it can be observed that over time, the spectra of healthy pepper leaves exhibit a clear separation in the 760–1000 nm range. The average spectral reflectance of the leaves gradually decreases, primarily due to slow cellular metabolism and water loss after ex vitro culture. In other wavelength ranges, the overall spectral curves of the healthy group are closely overlapping, indicating that during dynamic monitoring, the physiological state of the healthy group remains stable.
In Figure 3(b), the spectra of the inoculated group show significant differences in the 500–670 nm, 680–760 nm, and 760–1000 nm wavelength ranges. This indicates that the physiological activity of the inoculated group fluctuates over time, which also partly reflects the effectiveness of inoculation. Specifically, the spectral curves of inoculated leaves gradually separate in the 500–670 nm range over the collection period, and the average spectral reflectance increases. This is mainly due to the decrease in pigment content, such as chlorophyll and carotenoids, in the leaf cells due to pathogen infection, leading to reduced light absorption and increased reflectance. The 680–760 nm range, which is the boundary between visible and near-infrared light, corresponds to the red edge of green plants and is a key indicator of plant pigment status and health. In this range, the spectral reflectance increases most rapidly.
In general, the better the plant growth status, the red edge will show a red shift; conversely, it will shift towards the blue, or blue shift, indicating that with the passage of inoculation time, the red edge of the inoculated samples gradually shifts to the left, or blue shift. From Figure 3, it can be seen that compared with the average spectral curves of healthy plants, the average spectral curves of infected plants undergo varying degrees of change, suggesting the potential for using spectral characteristics to determine the earliest time point for identifying the latent period of crop diseases. However, simply analyzing the overall trend of spectral curve changes during the collection period does not directly indicate the earliest time for disease latent period identification. Appropriate measurement methods are required to deeply explore the differences between spectral curves.
Table 1: Changes in RGB Image and Principal Component Distribution Visualization Images of Samples Over Collection Time
Recommended:
Hyperspectral Imaging System iSpecHyper-VS1000
The latest product specifically designed for fields such as police criminal investigation, forensic evidence identification, medical care, precision agriculture, and mineral geological exploration has several main advantages: compact size, high frame rate, high spectral resolution, and high image quality, offering excellent cost performance. It adopts the push-broom principle with transmission grating for hyperspectral imaging. The system integrates a high-performance data acquisition and analysis processing system, features high-speed USB 3.0 interface transmission, and a full-frame high imaging quality optical design. The objective lens interface is a standard C-Mount, allowing for the replacement of the objective lens based on user requirements.
PRODUCTS
Copyright © 2025 Lisen Optics (Shenzhen) Co., Ltd.